FIGURE SUMMARY
Title

A zebrafish model of congenital nephrotic syndrome of the Finnish type

Authors
Lee, M.S., Devi, S., He, J.C., Zhou, W.
Source
Full text @ Front Cell Dev Biol

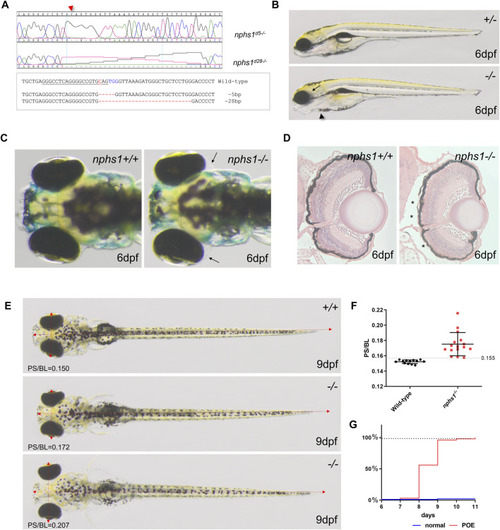
Generation of nphs1 mutant zebrafish by CRISPR/Cas9-mediated gene editing. (A) Sanger sequencing of the two different nphs1 mutant alleles. Sequence alignment of two nphs1 mutant alleles compared to the wild-type nphs1 gene sequence. PAMs are shown in blue color and sgRNA target sequence is underlined. The DNA break site by Cas9 is indicated red. (B) Morphological phenotype of nphs1 mutant at 6 dpf. The nphs1 mutant exhibited peri-orbital edema (arrow) and mild pericardial edema (arrowhead). (C) Dorsal view of the head region of zebrafish larvae. The nphs1 mutants exhibit peri-orbital edema (arrows) compared to wild-type siblings at 6 dpf. (D) Cross sections of periorbital region in wild-type and nphs1 mutants at 6 dpf. H&E staining shows the severity of peri-orbital edema (asterisks). (E) nphs1-/- develops severe periorbital and whole-body edema at 9 dpf compared to wild-type siblings. Red arrows indicate the pupil spacing distance (PS) and the body length (BL). (F) Scatter plot showing measurement of PS/BL in nphs1 mutants at 9 dpf. Each data point represents an individual larva and lines indicate the mean values. The error bars show the standard error of the mean (SEM). (G) Progression of the peri-orbital edema in nphs1 mutants (red line) and wild-type controls at 6–11 dpf.

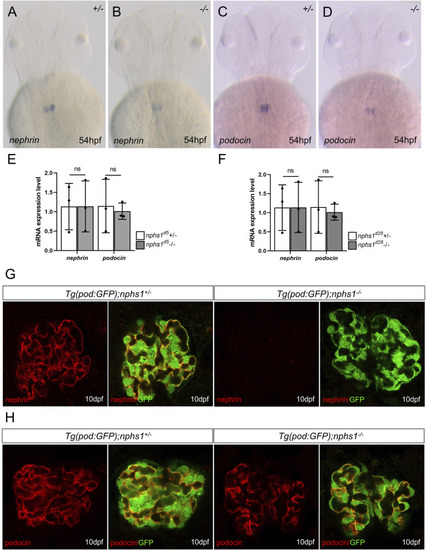
The expression analyses of nephrin and podocin in nphs1 mutants. Whole-mount in situ hybridization for nephrin (A–B) and podocin (C–D) at 54 hpf (E–F) Quantitative PCR analyses of mRNA levels of nphs1 and nphs2 show no statistically significant difference between nphs1 heterozygotes (+/-) and nphs1 homozygous mutants (-/-) at 7 dpf for both 5bp deletion (d5) and 28bp deletion (d28) mutant alleles. The expression level is normalized to that of eflα. The error bars show the standard error of the mean (SEM). (G–H) Confocal images of Immunofluorescence staining for nephrin (G, red) and podocin (H, red) at 10 dpf. Podocytes are marked by GFP expression (green) by the Tg (pod:GFP) transgene. No nephrin expression is detected in Tg (pod:GFP); nphs1-/- at 10 dpf, while podocin is present with a grainy pattern.

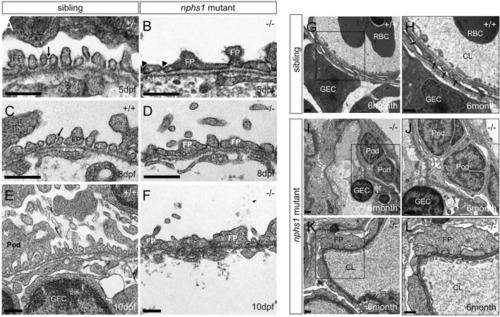
Lack of nephrin results in absence of slit-diaphragms and foot process effacement. (A,C,E) Transmission Electron Micrographs (TEM) of the podocytes foot processes in wild type zebrafish at 5, 8, 10 dpf. Presence of slit diaphragms are marked with arrows. (B,D,F) TEM of the podocyte foot processes in nphs1-/- at 5, 8, 10 dpf showing widened and irregular foot processes effacement with lack of detectable slit diaphragms (arrowheads) (Scale bar, 400 nm). (G–H) TEM of the mesonephric podocytes foot processes in 6-month-old adult wild-type siblings. Presence of slit diaphragms are marked with arrows. (I–L) TEM of the mesonephric podocytes foot processes in viable nphs1-/- adults. The foot processes are effaced and widened with absence of slit diaphragm throughout capillary wall in 6-month-old adult nphs1 mutants. (H,J,L) Higher-magnification images show podocyte foot-process effacement in nphs1-/- adults. Pod: podocyte; FP: foot process, GEC: glomerular endothelial cells; CL: glomerular capillary lumen; RBC: red blood cell.

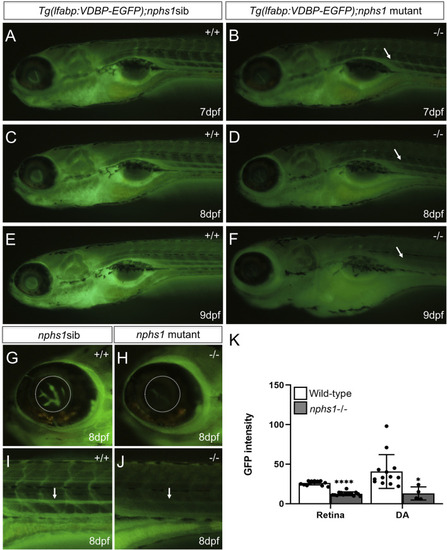
Measurement of hypoalbuminemia-like phenotype in nphs1-/- zebrafish. (A,C,E) The GFP fluorescence in wild-type siblings with Tg (l-fabp:VDBP-EGFP) at 7-9 dpf. (B,D,F) The GFP fluorescence in nphs1-/- mutants with Tg (l-fabp:VDBP-EGFP) at 7-9 dpf. (G–J) The GFP fluorescence in retina vessels and dorsal aorta of wild type fish (G,I) and of nphs1-/- mutants (H,J) at 8 dpf. (K) The quantitative measurements of the GFP fluorescence intensity in the retinal vessels (G,H) and the dorsal aorta (I–J) (arrow) using ImageJ. The error bars show the standard error of the mean (SEM) (*p ≤ 0. 1, ****p ≤ 0. 0001) (Student’s t-test).

Acknowledgments
This image is the copyrighted work of the attributed author or publisher, and ZFIN has permission only to display this image to its users. Additional permissions should be obtained from the applicable author or publisher of the image. Full text @ Front Cell Dev Biol