IMAGE

FIGURE 4

ID
ZDB-IMAGE-221004-8
Genes
Source
Figures for Lee et al., 2022
Image
Figure Caption

FIGURE 4

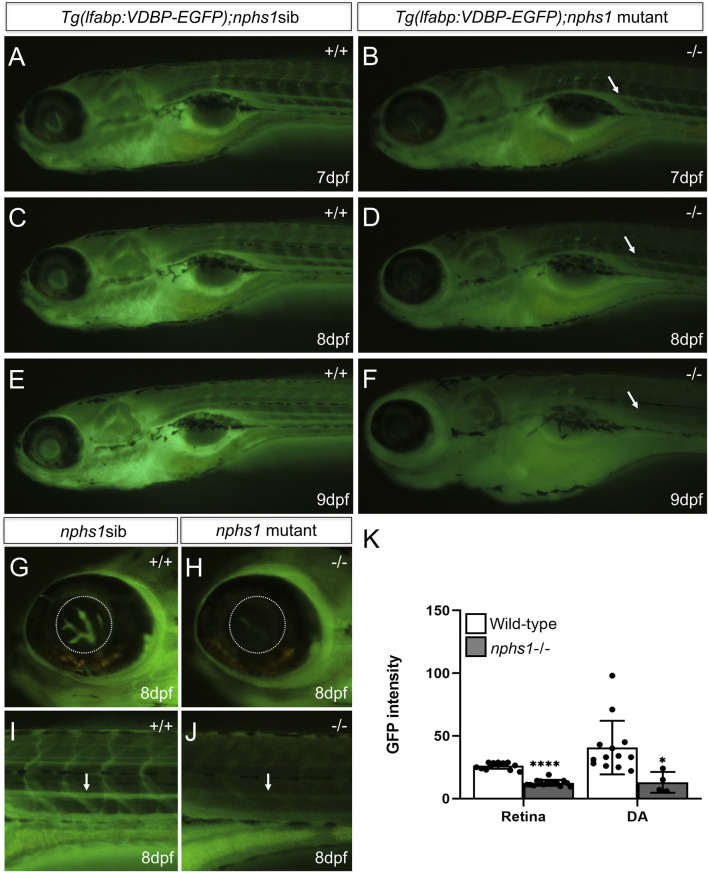
Measurement of hypoalbuminemia-like phenotype in nphs1-/- zebrafish. (A,C,E) The GFP fluorescence in wild-type siblings with Tg (l-fabp:VDBP-EGFP) at 7-9 dpf. (B,D,F) The GFP fluorescence in nphs1-/- mutants with Tg (l-fabp:VDBP-EGFP) at 7-9 dpf. (G–J) The GFP fluorescence in retina vessels and dorsal aorta of wild type fish (G,I) and of nphs1-/- mutants (H,J) at 8 dpf. (K) The quantitative measurements of the GFP fluorescence intensity in the retinal vessels (G,H) and the dorsal aorta (I–J) (arrow) using ImageJ. The error bars show the standard error of the mean (SEM) (*p ≤ 0. 1, ****p ≤ 0. 0001) (Student’s t-test).

Figure Data
Acknowledgments
This image is the copyrighted work of the attributed author or publisher, and ZFIN has permission only to display this image to its users. Additional permissions should be obtained from the applicable author or publisher of the image. Full text @ Front Cell Dev Biol