
- Title
-
Regulation of Nodal signaling propagation by receptor interactions and positive feedback
- Authors
- Preiß, H., Kögler, A.C., Mörsdorf, D., Čapek, D., Soh, G.H., Rogers, K.W., Morales-Navarrete, H., Almuedo-Castillo, M., Müller, P.
- Source
- Full text @ Elife
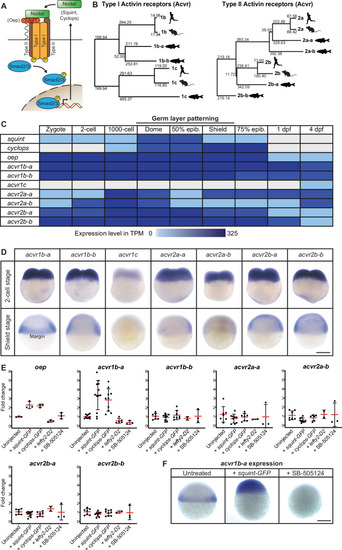
(A) In the classical model, Nodal signaling requires the recruitment of a receptor complex comprising the co-receptor Oep (Tdgf1 homolog) as well as Type I and Type II Activin receptors (Acvr) to induce phosphorylation and nuclear translocation of the signal transducer pSmad2/3 for the induction of Nodal target genes. (B) Phylogenetic neighbor-joining alignment tree of Type I and Type II receptor protein sequences from human, mouse, and zebrafish. Bootstrap values are listed at the nodes and indicate evolutionary distances. (C) Temporal expression analysis of putative Nodal receptors at different developmental stages. TPM: Transcripts per million. dpf: day(s) post-fertilization. Data adapted from White et al., 2017. (D) Spatial expression analysis of Type I and Type II receptors at 2 cell and shield stages revealed by in situ hybridization. Except for acvr1c, all receptor-encoding transcripts are maternally deposited. At shield stage, acvr1b-a is the only receptor that is not uniformly expressed but restricted to the embryonic margin. (E) Nodal signaling controls the expression of acvr1b-a and oep. Fold change of Nodal receptor expression calculated from qRT-PCR experiments comparing the overexpression of 30 pg squint-GFP mRNA, 30 pg cyclops-GFP mRNA, 30 pg lefty2-Dendra2 mRNA and exposure to 50 μM SB-505124 Nodal inhibitor to untreated embryos at 6 hours post-fertilization (hpf). Each point is the mean fold change of an individual embryo compared to an untreated embryo. Error bars represent standard deviation. (F) In situ hybridization analysis of acvr1b-a with increased (+squint GFP) or decreased (+SB-505124) Nodal signaling. Scale bar represents 250 µm. See the Figure 1—source data 1 file for source data and sample size.
|
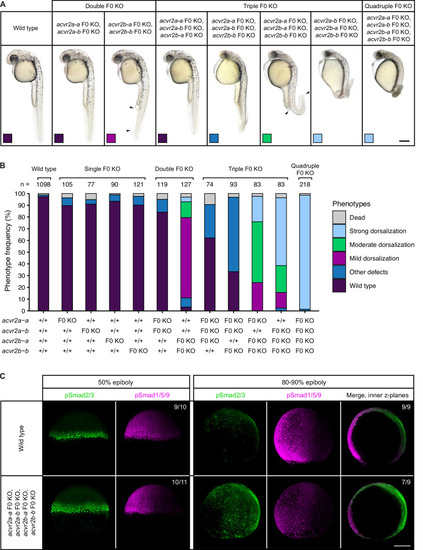
(A–B) Phenotypes of embryos upon single, double, triple, and quadruple CRISPR F0 KO of acvr2 receptors. (A) Lateral view of embryos of the indicated condition approximately 28–31 hpf. Arrowheads indicate the extent of ventral fin loss. Boxes indicate the phenotype class according to the scheme presented in (B). Scale bar represents 250 µm. (B) Frequency of phenotypes observed in embryos of the indicated condition at 1 dpf. n indicates the number of analyzed embryos. (C) Nodal and BMP signaling visualized by pSmad2/3 and pSmad1/5/9 immunostaining, respectively, in wild-type and quadruple acvr2 F0 KO embryos at 50% and 80–90% epiboly. Maximum intensity projections show lateral views with dorsal to the right. The number of embryos with the presented phenotype is indicated. Scale bar represents 200 µm. See the Figure 2—source data 1 file for source data.
|

Phenotypes of wild-type, MZoep and oep CRISPR F0 KO embryos compared to embryos depleted of either or both acvr1b-a and acvr1b-b using morpholino KDs, CRISPR F0 KOs and mutants. (A) Lateral view of embryos of the indicated condition approximately 28–31 hpf. Large arrowheads point to a single cyclopic eye, small arrowheads to fused or convergent eyes. Boxes indicate the phenotype class according to the scheme presented in (C). Scale bar represents 250 µm. (B) Nodal signaling visualized by pSmad2/3 immunostaining in embryos of the indicated condition (A) at 50% epiboly. Maximum intensity projections show lateral views. The number of embryos with the presented phenotype is indicated. Scale bar represents 200 µm. (C) Frequency of phenotypes observed in embryos of the indicated condition 1 dpf. n indicates the number of analyzed embryos. Note that one of the gRNAs used for acvr1b-b F0 KO has acvr1b-a as a predicted off-target, likely explaining the rare occurrences of the convergent eyes phenotype (see Materials and methods). See the Figure 3—source data 1 file for source data.
|

(A,B) Influence of acvr1b-a and acvr1b-b on the Nodal signaling range at shield stage. The range of Nodal signaling in shield-stage wild-type, knockdown and rescued embryos was determined by counting the maximum number of nuclei tiers positive for pSmad2/3 immunostaining from the embryonic margin towards the animal pole (i.e. the number of pSmad2/3 positive nuclei tiers at the dorsal side). acvr1b-at03pm/t03pm mutants and 0.4 ng acvr1b-b transcriptional start site-targeting morpholino (MO-1) were used for receptor loss-of-function conditions. Receptor loss-of-function was rescued with 50 pg of acvr1b-a or 25 pg of acvr1b-b mRNA. Data was obtained from three independent replicate experiments. (A) Maximum intensity projections show dorsal views. Scale bar represents 200 µm. (B) n indicates the number of analyzed embryos. Averages are displayed in red, and error bars show standard deviation. (C) Rescue of Type I receptor function after combinatorial mutation/knockdown using acvr1b-a and acvr1b-b mRNA. To deplete the Type I receptors, the acvr1b-at03pm/t03pm mutant was used in combination with 0.4 ng acvr1b-b transcriptional start site-targeting morpholino (MO-1). mRNA amounts are given in pg. n indicates the number of analyzed embryos. Note that strong overexpression of Acvr1b-a receptor-encoding mRNA leads to high lethality or tissue aggregates that eventually disintegrate (termed ‘Nodal gain-of-function’). See the Figure 4—source data 1 file for source data.
|
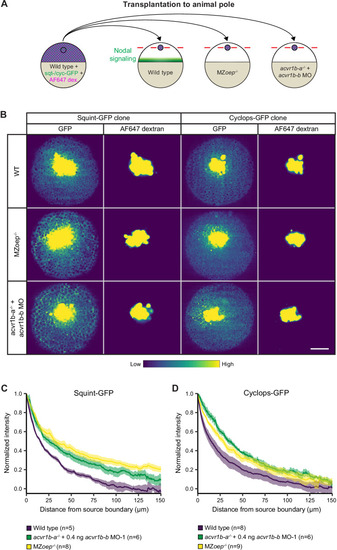
(A) Schematic of the transplantation assay to create ectopic Nodal signaling sources. Cells from the animal pole of sphere-stage wild-type embryos injected with squint-GFP or cyclops-GFP mRNA and Alexa Fluor 647 dextran (AF647 dex.) were transplanted to the animal pole of wild-type, MZoep-/-, or acvr1b-a-/- + acvr1b-b MO-1 embryos (hosts). Host embryos were imaged 60 min post-transplantation to determine the dispersal of Nodal ligands secreted by the clone. (B) Animal-pole view of transplanted Squint-GFP or Cyclops-GFP clones in the indicated host embryo 60 min post-transplantation. Single z-slices show the ligand distribution (GFP signal) and the transplanted cells (AF647 dextran signal). Scale bar represents 100 µm. (C,D) Quantification of Squint-GFP (C) and Cyclops-GFP (D) signal distributions in wild-type, MZoep-/- and acvr1b-a-/- + acvr1b-b MO-1 embryos. The mean normalized background-subtracted intensities are shown as a function of their distance from the transplantation site. The error bars (shaded regions) indicate SEM. The number of measured embryos is indicated in parentheses. See the Figure 5—source data 1 file for source data.
|
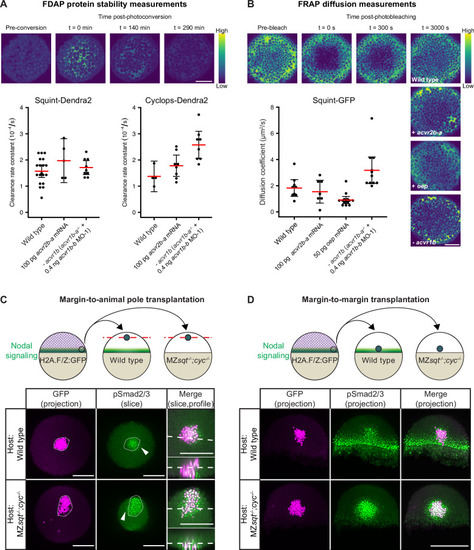
(A) Impact of acvr1 loss-of-function and acvr2b-a overexpression on Squint- and Cyclops-Dendra2 clearance rate constants determined using FDAP measurements. For acvr1 loss-of-function, 0.4 ng acvr1b-b MO-1 were injected into acvr1b-a-/- mutant embryos. For overexpression, 100 pg acvr2b-a mRNA were injected into wild-type embryos. Mean extracellular clearance rate constants are displayed in red, and individual measurements are shown as black dots. Error bars represent 95% confidence intervals. See Figure 6—figure supplement 1A for representative fits. (B) Influence of receptor levels on Squint- and Cyclops-GFP diffusivities determined using FRAP measurements. For overexpression, either 50 pg oep mRNA or 100 pg acvr2b-a mRNA were injected into wild-type embryos at the one-cell stage. acvr1b-a mutants and 0.4 ng acvr1b-b transcriptional start site-targeting morpholino (MO-1) were used for receptor loss-of-function conditions. The mean diffusion coefficients are displayed in red, and individual measurements are shown as black dots. Error bars represent 95% confidence intervals. See Figure 6—figure supplement 1B for representative fits. Scale bars represents 100 µm. (C) Margin-to-animal pole transplantations show that Nodals at endogenous expression levels can signal to distant cells. Top panel: Experimental setup of the margin-to-animal pole transplantations, in which wild-type embryos or MZsqt-/-;cyc-/- embryos that lack Nodal relay were used as hosts. Bottom panel: Immunofluorescent stainings show that pSmad2/3-positive nuclei (green) are detected outside of the transplanted clones (magenta) in both wild-type (top row) and MZsqt-/-;cyc-/- (bottom row) hosts. (D) Margin-to-margin transplants show that Nodals at endogenous expression levels can signal to distant cells at the embryonic margin. Top panel: Experimental setup. Bottom panel: Representative maximum intensity projections of immunofluorescent stainings. Transplantations into wild-type embryos (top row) and MZsqt-/-;cyc-/- embryos (bottom row) are shown. Scale bars represent 200 µm. Animal pole views are shown in (A–D). See the Figure 6—source data 1 file for source data and sample size.
|