
- Title
-
Embryonic Arsenic Exposure Triggers Long-Term Behavioral Impairment with Metabolite Alterations in Zebrafish
- Authors
- Abu Bakar, N., Wan Ibrahim, W.N., Che Abdullah, C.A., Ramlan, N.F., Shaari, K., Shohaimi, S., Mediani, A., Nasruddin, N.S., Kim, C.H., Mohd Faudzi, S.M.
- Source
- Full text @ Toxics
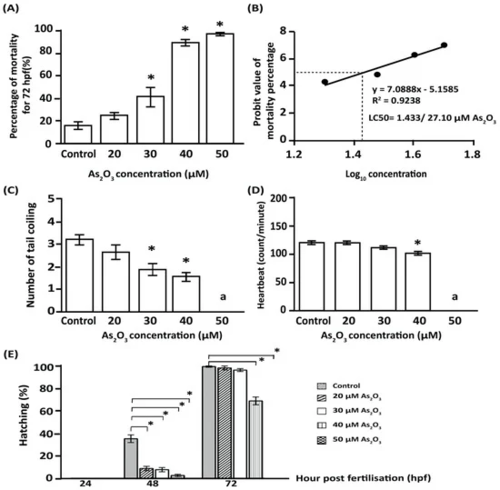
Figure 1. The toxicity effects of As2O3 on zebrafish (Danio rerio) embryos. (A) Exposure to As2O3 increased embryo mortality in a dose-dependent manner. (B) LC50 for As2O3. (C) Exposure to 30 µM and 40 µM As2O3 significantly decreased the incidence of tail coiling in 24 hpf embryos. (D) Exposure to 40 µM As2O3 significantly decreased the heartbeat of embryos examined at 48 hpf. (E) Exposure to increased As2O3 concentrations significantly delayed hatching between 48 hpf and 72 hpf. Data are presented as mean ± SEM of triplicate wells (n = 90 embryos per exposure group), with significant differences relative to the control group. ∗ (p ≤ 0.05); a no tail coiling, and heartbeats were recorded for 50 µM As2O3 exposed embryos, as all embryos were dead at 24 hpf.
|
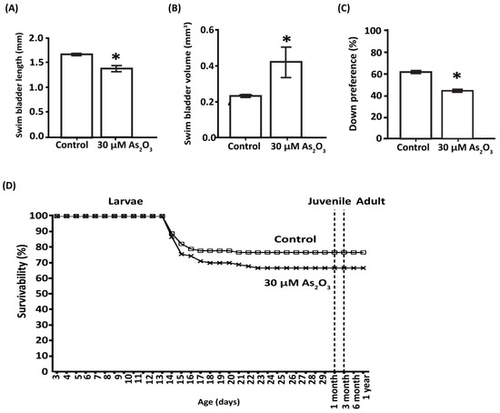
Figure 2. Effects of embryonic As2O3 exposure in 6 dpf larvae and adult zebrafish. At 6 dpf, As2O3 exposure increased swim bladder inflation/volume (B), although its anterior–posterior length was shortened (A). (C) With change in swim bladder volume, As2O3 exposure also affected swimming behavior, with reduced down preference. (D) In adults, embryonic As2O3 exposure resulted in a reduced percentage of survivability in As2O3 exposed larvae (
|
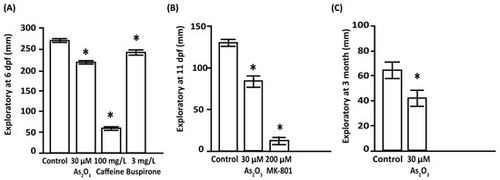
Figure 3. Effects of long-term impairment of 30 µM As2O3 exposure on exploratory activity. Exploratory activity was persistently decreased in larvae from 6 dpf (A) and 11 dpf (B) to adult stage (C). Data are presented as mean ± SEM, (∗ p ≤ 0.005), n = 30 larvae per group, n = 22 adults per group), with significant differences relative to the control group, ∗ (p ≤ 0.05).
|
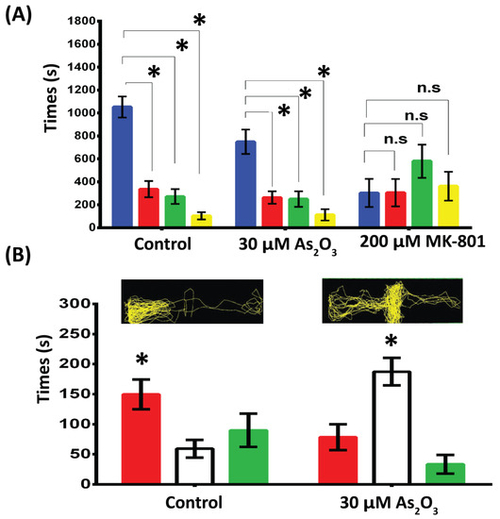
Figure 4. Effects of embryonic As2O3 exposure on the color preference of larval (11 dpf, A) and adult zebrafish (B). (A) In the 11 dpf larval test, a cross maze with four different-colored cambers was used. Reduction in color preference for blue in As2O3-exposed larvae compared to the control group. No significant differences were observed in color preference for red and green in control or As2O3-exposed larvae. However, MK-801-exposed larvae showed no clear color preference (B) Five-minute video tracking of color preference in adult fish after associative learning. Adult fish were acclimated to the three-chamber maze for 6 days with red food association before the test on the 7th day. As2O3-exposed zebrafish showed no significant preference for either green or red color Data are presented as mean ± SEM, (∗ p ≤ 0.005). n = 30 larvae per group, n = 22 adults per group. ∗ Significance at p ≤ 0.05 between left/center/right and between two color arms for each test, n.s: not significant.
|

Figure 5. OPLS−DA score plot and loading scatter plot (A,B) of negative and positive (C,D) modes based on the zebrafish larvae normalized data exposed to 30 µM As2O3 in comparison to control larvae. (E) Differential expression of metabolites in As2O3-exposed larvae produced by hierarchical clustering of the most significantly upregulated (red) and downregulated (blue) metabolites obtained from in negative- and positive-ion modes compared to the control group based on the log2 fold change value. (F) Metabolic set enrichment analysis of lipid metabolites in 6 dpf zebrafish showed the biosynthesis of unsaturated fatty acids, arachidonic metabolism, and sphingolipid were dysregulated after embryonic exposure to As2O3. Color intensity (yellow–to–orange/red) represents increasing statistical significance, whereas circular diameter is related to pathway impact. The graph was obtained by plotting−log of p-values from pathway enrichment analysis on the y-axis and the pathway impact values derived from pathway topology analysis on the x-axis.
|
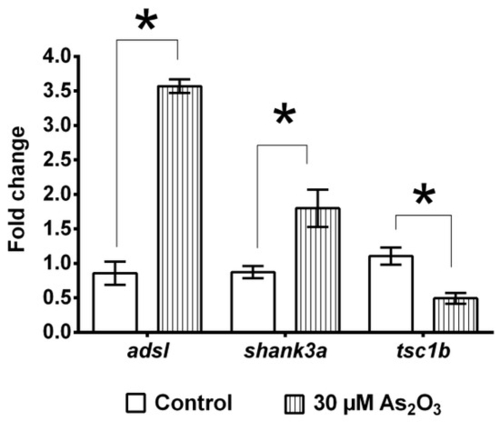
Figure 6. Embryonic exposure to As2O3 induced alterations in transcriptional regulation of ASD-associated genes. As2O3 exposure resulted in significant overexpression of adsl and shank3a, whereas tsc1b was downregulated. Data are presented as the mean ± SEM, (* p < 0.05) (n = 90 per group).
|