
- Title
-
Glucocorticoid receptor activation reduces food intake independent of hyperglycemia in zebrafish
- Authors
- Nipu, N., Antomagesh, F., Faught, E., Vijayan, M.M.
- Source
- Full text @ Sci. Rep.
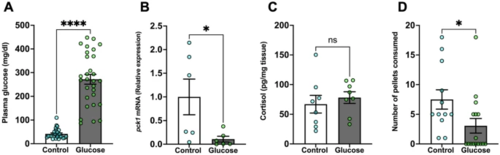
Glucose exposure inhibits food intake. (A) Plasma glucose was significantly higher in the glucose-treated fish compared to the control fish. (B) pck1 transcript abundance in the liver significantly decreased after glucose treatment compared to the control fish. (C) Whole-body cortisol levels remained unchanged in the glucose-treated fish compared to the control fish. (D) Glucose-treated fish consumed significantly fewer pellets than the control. Values are means ± SEM. (Plasma glucose n = 27–29; Transcript abundance n = 6; Whole-body cortisol n = 8; Feeding performance n = 12–16). ns—not significant; *(P < 0.05); ****(P < 0.0001)). |
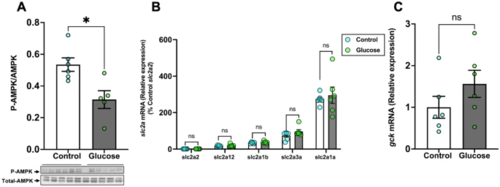
Glucose reduces AMPK phosphorylation in the brain. (A) Glucose exposure decreased the ratio of phosphorylated to total AMPK (M.W.:62 kDa) in the brain compared to the control. (B) The transcript levels of the glucose transporters (slc2a’s) in the brain did not change after glucose exposure. As we were comparing relative abundance of all slc2a’s in the brain, we chose to normalize all slc2a’s to the slc2a2, which showed the lowest transcript abundance. (C) mRNA levels of glucokinase (gck) remained unchanged after glucose exposure when compared to the control. Values are means ± SEM. (AMPK expression n = 5–6; Transcript abundance n = 6). ns—not significant; *(P < 0.05). |
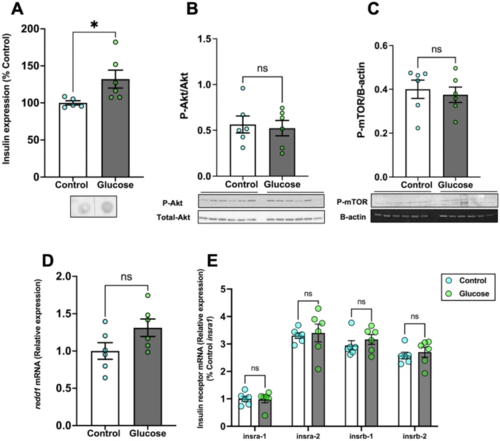
Glucose did not affect Akt and mTOR phosphorylation. (A) Whole-body insulin expression significantly increased after glucose exposure compared to the control. (B) Glucose exposure did not alter the ratio of phosphorylated to total Akt (M.W.:60 kDa) in the brain when compared to the control. (C) The phosphorylation of mTOR (M.W.:289 kDa) also remained unchanged in the glucose-treated fish compared to the control. (D) Brain redd1 mRNA levels remained unchanged in the glucose-treated fish compared to the control. (E) The transcript levels of the insulin receptor genes in the brain did not change after glucose treatment. Values are means ± SEM. (Whole-body insulin n = 5–6; Protein expression n = 6; Transcript abundance n = 6). ns—not significant; *(P < 0.05). |
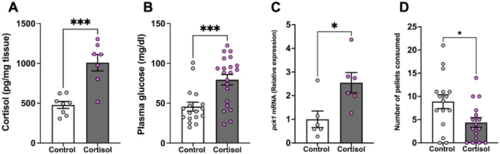
Cortisol suppresses feeding. (A) Whole-body cortisol levels were higher in the cortisol-treated fish compared to the control. (B) Cortisol treatment significantly increased plasma glucose levels. (C) The pck1 transcript abundance in the liver significantly increased after cortisol treatment compared to the control. (D) Cortisol-treated fish consumed significantly fewer pellets than the control. Values are means ± SEM (Whole-body cortisol n = 7–8; Plasma glucose n = 17–21; Transcript abundance n = 6; Feeding performance n = 16). ns—not significant; *(P < 0.05); ***(P < 0.001). |
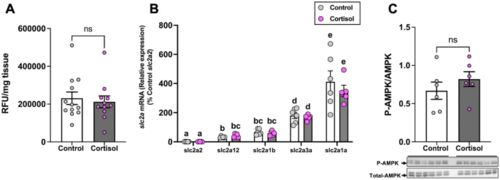
Cortisol does not affect brain glucose uptake. (A) Uptake of the fluorescent glucose analogue 2-NBDG in the brain of the cortisol-treated fish remained unchanged compared to the control. (B) The transcript levels of the glucose transporters (slc2a’s) in the brain did not change after cortisol exposure. (C) Cortisol treatment did not change the ratio of phosphorylated to total AMPK (M.W.:62 kDa) in the brain. Values are means ± SEM (Relative fluorescence units; RFU n = 11–12; Transcript abundance n = 5–6; AMPK expression n = 6). ns—not significant; Bars with different letters are significantly different (one-way ANOVA; P ≤ 0.05). |
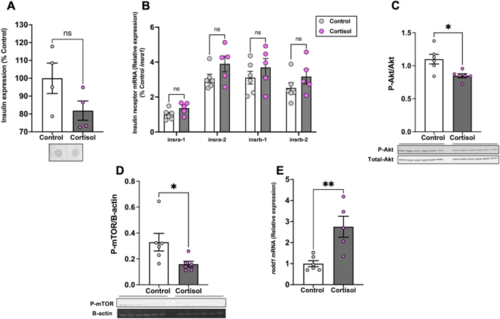
Cortisol affects brain Akt and mTOR phosphorylation. (A) Cortisol treatment did not change whole-body insulin expression levels. (B) We observed no changes in the transcript levels of the insulin receptor genes in the brain after cortisol treatment. (C) The ratio of phosphorylated to total Akt (M.W.:60 kDa) in the brain was significantly lower in the cortisol-treated fish when compared to the control. (D) The phosphorylation of mTOR (M.W.:289 kDa) was also significantly lower after cortisol treatment. E. redd1mRNA levels significantly increased in the brain of the cortisol treated group compared to the control. Values are means ± SEM (Whole-body insulin n = 4; Protein expression n = 6; Transcript abundance n = 5–6). ns—not significant; *(P < 0.05); **(P < 0.01). |
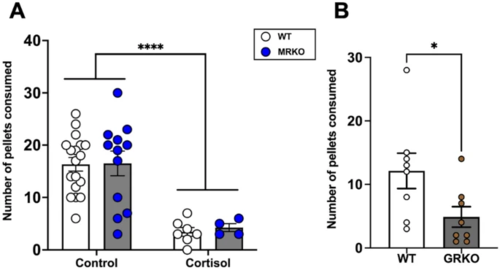
Loss of GR suppresses food intake. (A) MRKO fish lacks MR, while GR activation by cortisol treatment reduces the food consumed (control groups of both genotype had 12–18 fish and the cortisol group had 4–7 fish). *Significantly different from the control (2-way ANOVA; P < 0.001). (B) In fish lacking GR (GRKO) also the food intake was reduced (n = 8). Values are means ± SEM. ns—not significant; *(P < 0.05); ****(P < 0.0001). |
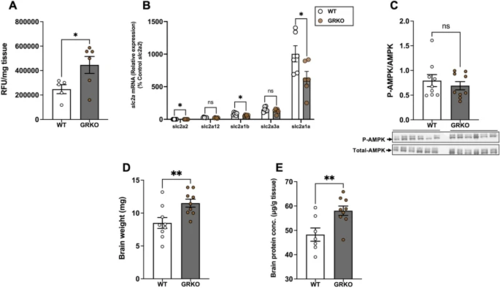
Loss of GR increases brain glucose uptake. (A) GRKO fish had significantly higher uptake of the fluorescent glucose analogue 2-NBDG in the brain than the WT. (B) The transcript levels of slc2a1a, slc2a1b and slc2a2 in the brain was lower in the GRKO fish compared to the WT, but the expression of slc2a3a and slc2a12 remained unchanged. (C) Loss of GR did not change the ratio of phosphorylated to total AMPK (M.W. 62 kDa) in the brain. (D) GRKO fish had significantly higher brain mass compared to the WT. E. Brain protein concentration was significantly higher in the GRKO fish compared to WT. Values are means ± SEM (Relative fluorescence units; RFU n = 5–6; Transcript abundance n = 6; AMPK expression n = 9; Brain wet weight n = 9; Brain protein concentration n = 7–9). ns—not significant; *(P < 0.05); **(P < 0.01). |
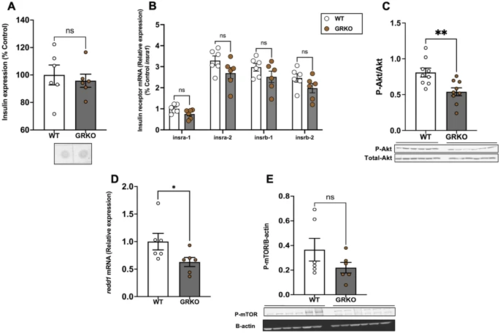
Loss of GR affects brain Akt phosphorylation. (A) Whole-body insulin levels remained unchanged in the GRKO fish compared to WT. (B) The transcript levels of the insulin receptor genes in the brain remained unchanged in GRKO fish compared to WT. (C) Loss of GR significantly decreased the ratio of phosphorylated to total Akt (M.W. 60 kDa) in the brain. (D) redd1 mRNA levels significantly decreased in the brain of GRKO fish compared to WT. E. The phosphorylation of mTOR (M.W. 289 kDa) remained unchanged when compared to the WT. Values are means ± SEM (Whole-body insulin n = 6; Protein expression n = 6–9; Transcript abundance n = 6). ns—not significant; *(P < 0.05); **(P < 0.01). |