
- Title
-
A PI3Kγ signal regulates macrophage recruitment to injured tissue for regenerative cell survival
- Authors
- Zhou, S., Liu, Z., Kawakami, A.
- Source
- Full text @ Dev. Growth Diff.
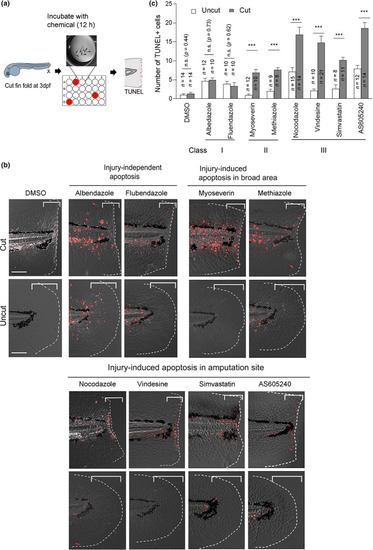
Screening compounds that induce apoptosis in the larvae fin fold. (a) Schematic overview of the screening procedure. Wild type (WT) zebrafish larvae were amputated at 3 days post fertilization (dpf) and incubated with the compounds for 12 h in a 24‐well plate. Uncut larvae were also incubated as a control. Apoptotic effects were evaluated by TUNEL (terminal deoxynucleotidyl transferase dUTP nick end labeling) staining. (b) Representative apoptosis phenotypes caused by the respective chemicals. Class I compounds (albendazole and flubendazole) induced ubiquitous apoptosis in cut and uncut larvae. Class II and III compounds induced apoptosis in response to tissue amputation. Class III compounds (nocodazole, vindesine, simvastatin, and AS605240), induced apoptosis mostly close to the amputation site, whereas class II compounds (myoseverin and methiazole) induced apoptosis in broader areas. Scale bar, 50 μm. (c) Quantification of the number of apoptotic cells in the bracketed areas from the posterior end of the notochord to the amputation plane in (b). Data are presented as the mean ± SEM. Student's t‐test. ***p < 0.001. n.s., not significant. DMSO, dimethyl sulfoxide PHENOTYPE:
|
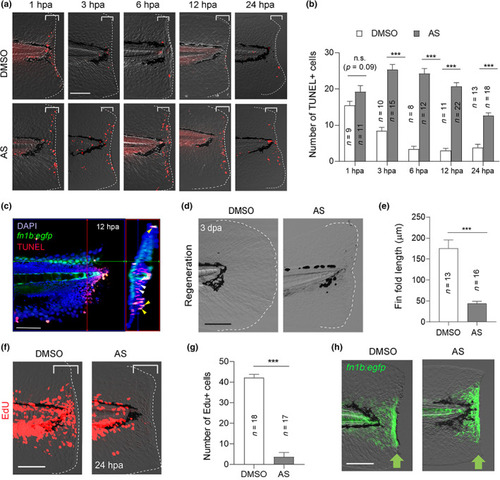
Phenotype caused by the PI3Kγ inhibitor, AS. (a) Terminal deoxynucleotidyl transferase dUTP nick end labeling (TUNEL) analysis of cell death at different stages of fin fold regeneration using dimethyl sulfoxide (DMSO)‐ and AS‐treated larvae. Scale bar, 50 μm. (b) Quantification of TUNEL‐positive cells in the injured site (bracketed areas) in (a). The data at 12 hpa (hours post amputation) in Figure 1bwere also used for statistical analysis. (c) Confocal image of the fin fold of Tg(fn1b:egfp) (green) at 12 hpa wherein apoptotic cells were detected by TUNEL staining (red). Right panel, the longitudinal transverse optical section at a plane indicated by the red line. DAPI, nuclear staining with 4′,6‐diamidino‐2‐phenylindole dihydrochloride (0.1 mg/mL). The enhanced green fluorescent protein (EGFP) fluorescence marks the epithelial cells expressing fn1b. Yellow and white arrowheads indicate representative epithelial and mesenchymal cells, respectively. Scale bar, 50 μm. (d) Fin fold regeneration in DMSO‐ and AS‐treated larvae at 3 dpa. Scale bar, 50 μm. (e) Quantification of the regenerated fin fold length from the posterior to the end of notochord in (d). (f) Detection of proliferating cells by 5‐ethynyl l‐2′‐deoxyuridine (EdU) incorporation in the DMSO‐ and AS‐treated larvae during 0–24 hpa. Scale bar, 50 μm. (g) Quantification of the number of EdU‐positive cells beneath the amputation site (bracketed areas) in (f). (h) Confocal image of the fin fold of Tg(fn1b:egfp) at 12 hpa in the DMSO‐ and AS‐treated larvae. Scale bar, 50 μm. (b, e, g) Data are presented as the mean ± SEM and analyzed by Student's t‐test; ***p < 0.001, n.s., not significant EXPRESSION / LABELING:
PHENOTYPE:
|
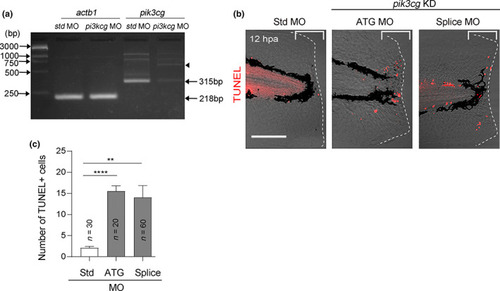
Pik3cg knockdown recapitulates the phenotypes in AS‐treated larvae. (a) RT‐PCR analysis of pik3cg mRNA expression in larvae injected with standard control (std) morpholino (MO) or splice site MO. Blocking mRNA splicing causes a premature stop codon and induces mRNA degradation. Arrowhead indicates a minor 750‐bp PCR product that may be derived from unspliced mRNA. (b) Terminal deoxynucleotidyl transferase dUTP nick end labeling (TUNEL) analysis of larvae injected with std‐, ATG‐, or splice MOs at 12 hpa. Scale bar, 50 μm. (c) Quantification of TUNEL‐positive cells in the injured site (bracket region) in (b). Statistical significance was tested by one‐way ANOVA; **p < 0.05, ***p < 0.001 PHENOTYPE:
|
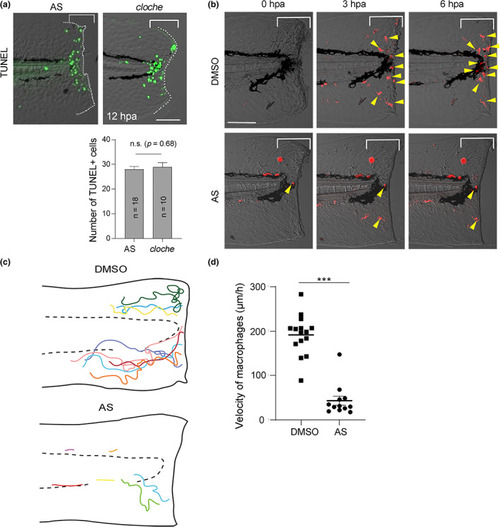
Loss of macrophage recruitment caused by PI3Kγ knockdown. (a) Comparison of regeneration‐dependent apoptosis of AS‐treated larva and cloche (clo) mutant. Terminal deoxynucleotidyl transferase dUTP nick end labeling (TUNEL) stained AS‐treated larva and clo mutant was compared side‐by‐side at 12 hpa. Scale bar, 50 μm. (b) Macrophage migration and accumulation at the injured site visualized by Tg(mpeg1:mCherry). The time‐lapse recording was done at 0–6 hpa with a confocal microscope using a water immersion objective lens, and the images were taken from the recorded live images. Yellow arrowheads indicate mpeg1 + macrophages. Scale bar, 50 μm. (c) Schematic diagrams showing a 6 h time‐lapse of the injured fin fold and migration trajectory of macrophages arriving at the wound in dimethyl sulfoxide (DMSO)‐ and AS‐treated larvae during the recruitment phase. Respective colored lines indicate the trajectories of individual macrophages. (d) Macrophage velocity quantification in DMSO‐ and AS‐treated larvae. Data are presented as the mean ± SEM and analyzed by Student's t‐test; ***p < 0.001. For further information, please refer to Videos S1 and S2 PHENOTYPE:
|
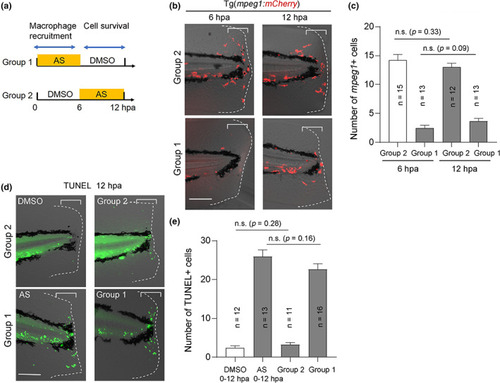
PI3Kγ function is required during the early stages of fin fold regeneration. (a) The experimental scheme of stage‐specific treatment of AS. Group 1 larvae were exposed to AS 0–6 hpa to block macrophage recruitment. Group 2 larvae were exposed to AS 6–12 hpa to allow macrophage recruitment. (b) Macrophage recruitment detected using Tg(mpeg1:mCherry) at 6 and 12 hpa. Macrophages accumulated in the injured site of only group 2 larvae. Scale bar, 50 μm. (c) Quantification of the number of mpeg1 + cells in the injured site (bracket areas) in (b). (d) Terminal deoxynucleotidyl transferase dUTP nick end labeling (TUNEL) analysis of two larval groups at 12 hpa. Scale bar, 50 μm. (e) Quantification of the number of TUNEL‐positive cells in the injured site (bracket areas) in (d). (c and e) Data are presented as the mean ± SEM. Statistical significance was analyzed using one‐way ANOVA. n.s., not significant PHENOTYPE:
|
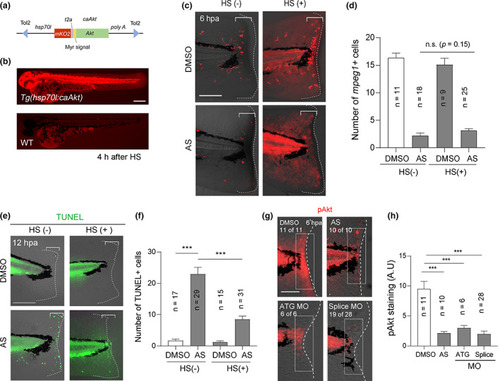
Akt functions in regenerative cells for their survival. (a) Schematic diagram of the overexpression construct. The zebrafish hsp70l promoter drives mKO2 and caAkt expression. (b) Induction of mKO2 expression in the embryo (2 dpf) of the Tg line, Tg(hsp70l:caAkt), after heat shock (HS). Scale bar, 250 μm. (c) TUNEL analysis at 12 hpa in the amputated fin fold with or without heat shock before amputation. Scale bar, 50 μm. (d) Quantification of the number of terminal deoxynucleotidyl transferase dUTP nick end labeling (TUNEL)‐positive cells in the injured site (bracket areas) in (c). (e) Analysis of mpeg1 + macrophage recruitment at 6 hpa in Tg(hsp70l:caAkt) with or without heat shock in the presence of dimethyl sulfoxide (DMSO) or AS. Scale bar, 50 μm. (f) Quantification of mpeg1 + cells in the bracketed areas in (e). Akt overexpression did not rescue the AS‐mediated defect in macrophage recruitment. (g) Immunostaining of phosphorylated Akt (pAkt, Ser 473) in DMSO‐ or AS‐treated larvae, and in the pik3cg morphants injected with ATG or splice MOs. Scale bar, 50 μm. (h) Quantification of the fluorescent intensity of pAkt staining in the bracketed areas in (g) by measuring the fluorescent intensity in the boxed area (50 μm × 150 μm) by Image J. (d, f, h) Data are presented as the mean ± SEM. Statistical significance was analyzed by one‐way ANOVA; ***p < 0.001; n.s., not significant EXPRESSION / LABELING:
PHENOTYPE:
|
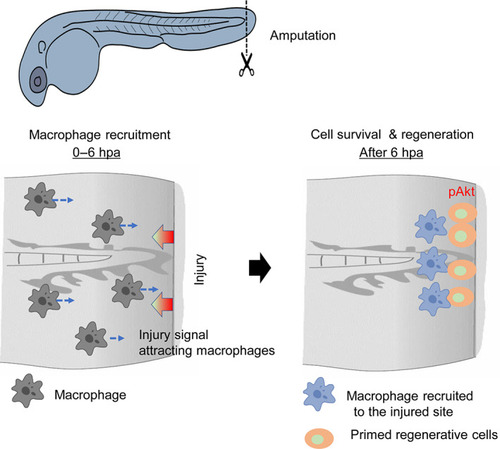
Summary of the roles of PI3Kγ for macrophage recruitment and survival of regenerative cells. The PI3Kγ‐mediated signal regulates the recruitment of macrophages to the injured tissue during the early regenerative stage. The macrophages recruited to the wounded site provide a diffusible substance for regenerative cell survival. Phosphorylation of Akt (pAkt) induced by macrophage recruitment supports cell survival |