
|
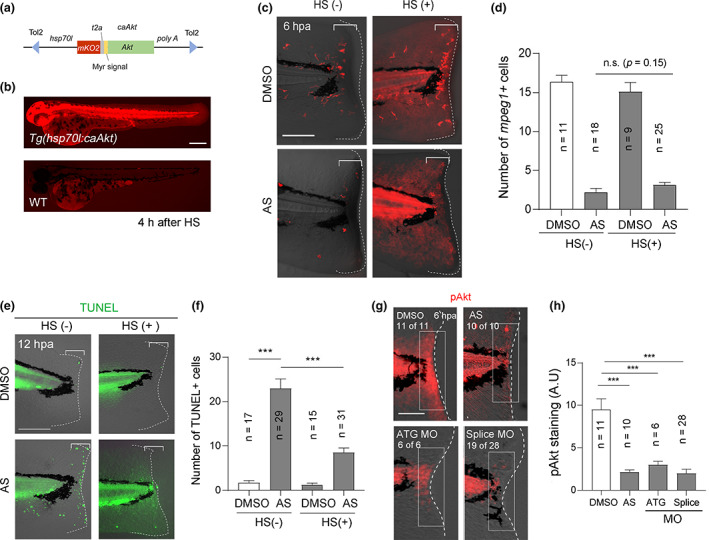
Fig. 6
Akt functions in regenerative cells for their survival. (a) Schematic diagram of the overexpression construct. The zebrafish hsp70l promoter drives mKO2 and caAkt expression. (b) Induction of mKO2 expression in the embryo (2 dpf) of the Tg line, Tg(hsp70l:caAkt), after heat shock (HS). Scale bar, 250 μm. (c) TUNEL analysis at 12 hpa in the amputated fin fold with or without heat shock before amputation. Scale bar, 50 μm. (d) Quantification of the number of terminal deoxynucleotidyl transferase dUTP nick end labeling (TUNEL)‐positive cells in the injured site (bracket areas) in (c). (e) Analysis of mpeg1 + macrophage recruitment at 6 hpa in Tg(hsp70l:caAkt) with or without heat shock in the presence of dimethyl sulfoxide (DMSO) or AS. Scale bar, 50 μm. (f) Quantification of mpeg1 + cells in the bracketed areas in (e). Akt overexpression did not rescue the AS‐mediated defect in macrophage recruitment. (g) Immunostaining of phosphorylated Akt (pAkt, Ser 473) in DMSO‐ or AS‐treated larvae, and in the pik3cg morphants injected with ATG or splice MOs. Scale bar, 50 μm. (h) Quantification of the fluorescent intensity of pAkt staining in the bracketed areas in (g) by measuring the fluorescent intensity in the boxed area (50 μm × 150 μm) by Image J. (d, f, h) Data are presented as the mean ± SEM. Statistical significance was analyzed by one‐way ANOVA; ***p < 0.001; n.s., not significant