
- Title
-
Altered Expression of TMEM43 Causes Abnormal Cardiac Structure and Function in Zebrafish
- Authors
- Zink, M., Seewald, A., Rohrbach, M., Brodehl, A., Liedtke, D., Williams, T., Childs, S.J., Gerull, B.
- Source
- Full text @ Int. J. Mol. Sci.
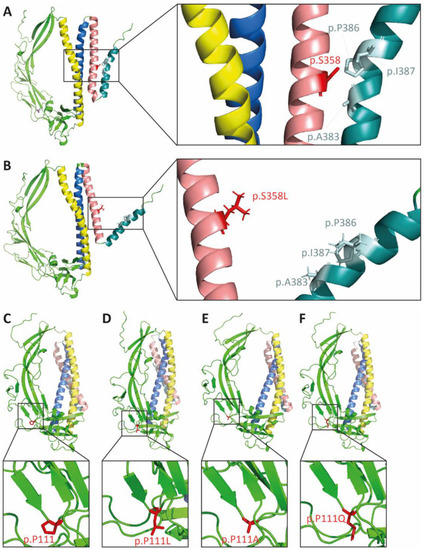
The p.S358L variant changes protein conformation of TMEM43. In silico modeling of TMEM43 tertiary structure of wild-type (A,C) and proteins with the corresponding missense mutations (B) p.S358L, (D) p.P111L, (E) p.P111A, and (F) p.P111Q. Yellow indicates transmembrane domain (TMD) 1, blue indicates TMD2, rose indicates TMD3, and turquoise indicates TMD4. The residue of interest is indicated in red (p.S358 in A and B; p.P111 in C–F). |
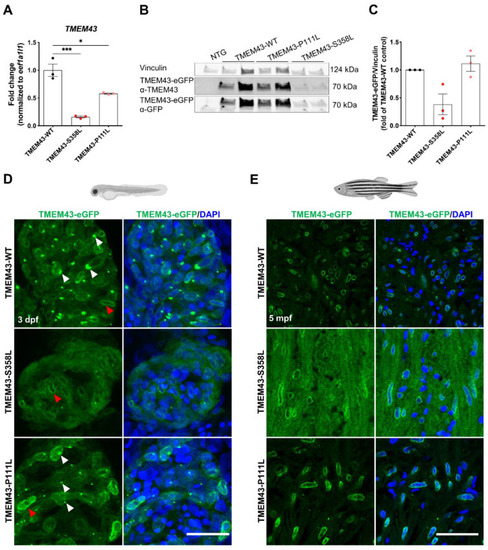
Reduced expression and altered localization of TMEM43-p.S358L. (A) Quantitative reverse transcription PCR demonstrates transcript reduction in human TMEM43 in adult ventricles of both TMEM43 variant transgenic lines compared to wild-type (WT). Each replicate consists of a pool of 2–7 ventricles and relative expression is calculated to TMEM43-WT expression levels. (B) Representative Western blot showing reduced occurrence of the human TMEM43-eGFP fusion-protein in adult ventricles of TMEM43-S358L compared to the TMEM43-WT transgenic line. For detection, both a TMEM43- and a GFP-antibody were used. Each biological replicate consists of a pool of 1–4 ventricles. (C) Western blot analysis using the TMEM43-antibody showed a reduced protein level of the human TMEM43-eGFP fusion-protein in adult ventricles of TMEM43-S358L compared to the TMEM43-WT transgenic line. Each data point represents relative Western blot band intensity of a technical replicate. (A,C) One-way ANOVA with Bonferroni’s multiple comparison test, * p ≤ 0.05, *** p ≤ 0.001. Error bars correspond to SEM. (D) Confocal images of whole-mount immunofluorescence staining of hearts expressing the transgene TMEM43-eGFP (green) at 3 days post-fertilization (dpf). Note the TMEM43-WT expression at the nuclear membrane and the endoplasmic reticulum (ER). TMEM43-S358L displays a weak signal at the nuclear membrane, but no signal at the ER. White arrowheads indicate TMEM43-eGFP localization at the ER, red arrowheads indicate localization at the nuclear membrane. Scale bar = 30 µm. (E) Confocal images of immuno-stained paraffin sections of 5 months post fertilization (mpf) dissected hearts expressing the transgene TMEM43-eGFP (green). Scale bar = 30 µm. Created with BioRender.com (accessed on 13 August 2022). |
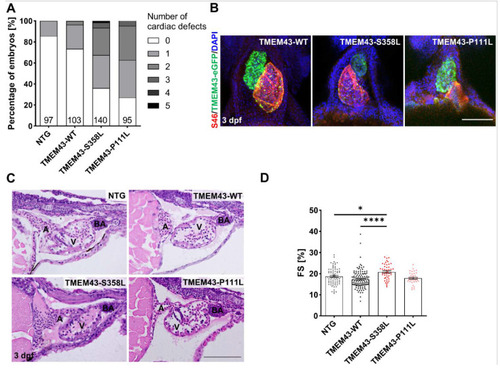
Overexpression of TMEM43 variants induce altered cardiac morphology and function at 3 days post-fertilization (dpf). (A) Visual phenotyping demonstrates the percentage of embryos with zero to five different cardiac-specific defects. The defects were classified into looping defects, pericardial edemas, arrhythmias, altered ventricular shape, strong ventricular contractions, heterogenous ventricular contractions, and altered atrial shape. Both TMEM43 variant lines show an increased percentage of embryos with at least one cardiac defect. The number of phenotyped embryos is indicated at the bottom of the columns. (B) Confocal maximum intensity projections of immunofluorescence-stained hearts. Atria are labeled for S46 localization (red), ventricles for GFP localization (green), and nuclei with DAPI (blue). In contrast to TMEM43-WT hearts, both TMEM43 variant lines display developmental defects (looping defects and reduced ventricular chamber size in TMEM43-S358L, as well as altered atrial chamber shape in TMEM43-P111L). Ventral views, arterial pole to the top. Scale bar = 100 µm. (C) Representative histological images of hematoxylin and eosin-stained sagittal plastic sections showing structurally normal heart chambers and the outflow tract in embryos at 3 dpf (n ≥ 5 per genotype). A, atrium; BA, Bulbus arteriosus; V, ventricle. Scale bar = 100 µm. (D) Analysis of cardiac function by ventricular fractional shortening (FS) quantification from a time series of the embryonic cardiac cycle. Data points represent the average measurement obtained from three diastolic/systolic phases of each fish. The short axis of the ventricle was used for quantification. Significantly increased FS was detected in TMEM43-S358L embryos. Significance was determined by one-way ANOVA with Bonferroni’s multiple comparison test, * p ≤ 0.05, **** p ≤ 0.0001. Error bars correspond to SEM. (A,D) Analyses were performed on embryos from three independent clutches per genotype. PHENOTYPE:
|
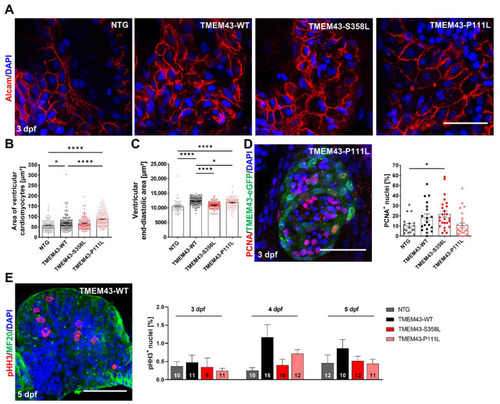
Cardiac overexpression of stably folded TMEM43 leads to hypertrophic ventricular growth, but unchanged proliferation capacity in embryos. (A) Confocal maximum intensity projections of 3 days post fertilization (dpf) hearts immunostained with DAPI (blue) and Alcam (red) to highlight plasma membranes. Scale bar = 30 µm. (B) Quantification of cardiomyocyte (CM) area represented in (A) reveals larger CMs in TMEM43-WT and TMEM43-P111L compared to non-transgenic control (NTG) and TMEM43-S358L individuals (n ≥ 10 hearts per genotype). (C) Quantification of ventricular end-diastolic area shows the mean area of three individual sections of each fish from a time series of the embryonic cardiac cycle. Significantly increased end-diastolic ventricular areas were measured in TMEM43-WT and TMEM43-P111L compared to NTG and TMEM43-S358L individuals. (D) Representative confocal maximum intensity projection of a heart immunostained with PCNA (red), GFP (green), and DAPI (blue) at 3 dpf. Scale bar = 50 µm. In the graph, individual data points represent the percentage of PCNA+ nuclei in the ventricle of each fish (n ≥ 18 individuals per genotype). A slightly increased proliferation rate was observed in the TMEM43-S358L transgenic line compared to NTG. (E) Representative maximum intensity projection of a dissected heart immunostained with pHH3 (red), MF20 (targeting MYH1E; green) and DAPI (blue) at 5 dpf. Scale bar = 50 µm. The graph displays the mean percentage of pHH3+ cell nuclei for each genotype at 3 dpf, 4 dpf, and 5 dpf. The number of analyzed hearts per condition are indicated at the bottom of the columns. (B–E) For all graphs, significance was determined by one-way ANOVA with Bonferroni’s multiple comparison test, * p ≤ 0.05, **** p ≤ 0.0001. Error bars correspond to SEM. PHENOTYPE:
|
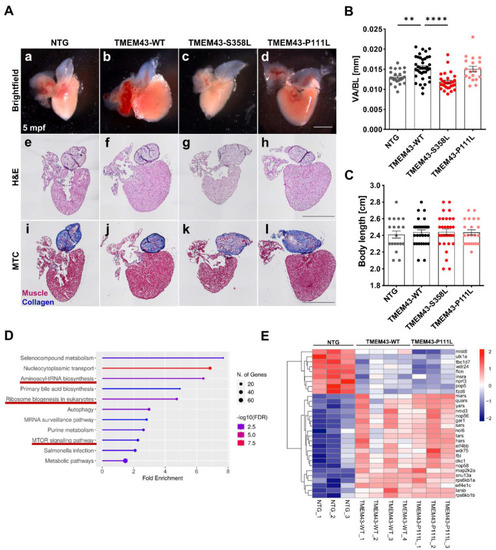
TMEM43 wild-type (WT) and TMEM43-P111L transgenic lines display enlarged hearts in adult zebrafish. (A) Preserved myocardial structure in adult zebrafish at 5 months post-fertilization (mpf) (n ≥ 5 hearts per genotype). Scale bars = 500 µm. (a–d) Representative brightfield images of dissected fish hearts. (e–h) Histology was analyzed by hematoxylin and eosin (H&E) staining. (i–l) Fibrosis was analyzed by Masson’s Trichrome (MTC) staining. (B) TMEM43-WT and TMEM43-P111L individuals display larger ventricles as indicated by an increased ventricular area to body length ratio (VA/BL) compared to the non-transgenic control (NTG) and TMEM43-S358L. Brightfield images represented in (a–d) were used for assessment of ventricular surface area. (C) Quantification of body length reveals normal growth and development of adult transgenic zebrafish. (D) Kyoto Encyclopedia of Genes and Genomes (KEGG) pathway enrichment analysis for shared differently expressed genes (DEGs) between “NTG vs. TMEM43-WT” and “NTG vs. TMEM43-P111L” (padj ≤ 0.05) using ShinyGO v0.76. The x-axis represents fold enrichment and y-axis represents enriched KEGG terms. The size of the dots represents the number of involved genes. The false discovery rate (FDR) value is indicated by colors.KEGG pathways, which include the DEGs shown in (E), are underlined in red and play a role for cell growth. (E) Heatmap showing DEGs belonging to the KEGG pathways “Aminoacyl-t-RNA biosynthesis”, “Ribosome biogenesis in eukaryotes”, and “mTOR signaling pathways”. (B,C) For all graphs, significance was determined by one-way ANOVA with Bonferroni’s multiple comparison test, ** p ≤ 0.01, **** p ≤ 0.0001. Error bars correspond to SEM. PHENOTYPE:
|
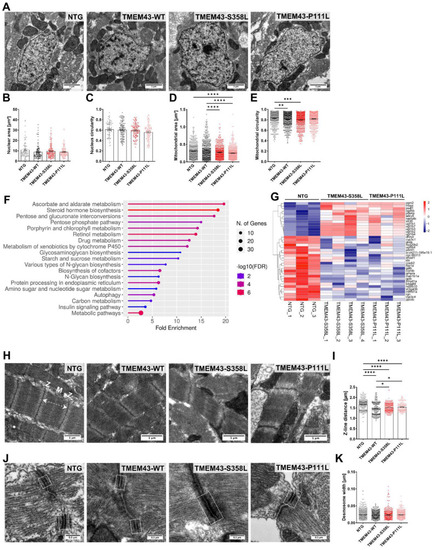
Transmission electron microscopy (TEM) reveals altered ultrastructure in ventricular heart tissue from TMEM43 transgenic lines at 5 months post-fertilization. (A) TEM images showing nuclei and mitochondria of the ventricular myocardium. Scale bars = 1 µm. (B) Analysis of the nuclear area and (C) circularity demonstrate no alterations between the genotypes. (D) Assessment of mitochondrial area uncovers significantly reduced mitochondrial size in both TMEM43 variant lines compared to TMEM43-WT. (E) Evaluation of mitochondrial circularity revealed altered mitochondrial shape in TMEM43-S358L and TMEM43-WT ventricles compared to the non-transgenic control (NTG). (F) Kyoto Encyclopedia of Genes and Genomes (KEGG) pathway enrichment analysis for shared differently expressed genes (DEGs) between “NTG vs. TMEM43-S358L” and “NTG vs. TMEM43-P111L” (padj. ≤ 0.05) using ShinyGO v0.76. The x-axis represents fold enrichment and y-axis represents enriched KEGG terms. The size of the dots represents the number of involved genes. The false discovery rate (FDR) value is indicated by colors. (G) Heatmap showing DEGs belonging to the KEGG pathway “Metabolic pathways”. (H) Representative TEM images of longitudinal sections of sarcomeres showing proper myofibrill organization. Dashed double-headed arrow indicates distance between two Z-discs. M, M-line; Z, Z-line. Scale bars = 1 µm. (I) Quantification of Z-line distance of sarcomeres represented in (H) reveals a significantly increased sarcomere length in both TMEM43 variant lines compared to the TMEM43-WT. NTG displayed the highest sarcomere length. (J) TEM images showing desmosomes of the ventricular myocardium. Dashed boxes indicate desmosomal junctions. Scale bars = 0.3 µm. (B–E,I,K) For all graphs, significance was determined by one-way ANOVA with Bonferroni’s multiple comparison test, * p ≤ 0.05, ** p ≤ 0.01, *** p ≤ 0.001, **** p ≤ 0.0001. Error bars correspond to SEM. n ≥ 3 per genotype. PHENOTYPE:
|
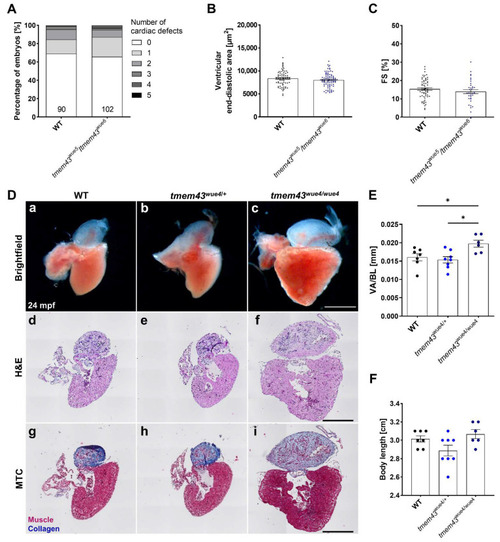
Enlarged adult hearts of homozygous tmem43wue4/wue4 mutant fish. (A) Phenotyping showing the percentage of embryos with zero to five different cardiac-specific defects. The defects were classified in looping defects, pericardial edemas, arrhythmias, altered ventricular shape, strong ventricular contractions, heterogenous ventricular contractions, and altered atrial shape. The number of analyzed embryos is indicated at the bottom of the columns. (B) Quantification of ventricular end-diastolic area showing the mean area of three individual sections of each fish from a time series of the embryonic cardiac cycle. (C) Analysis of cardiac function by quantification of ventricular fractional shortening (FS) from a time series of the embryonic cardiac cycle. Data points represent the average measurement obtained from three diastolic/systolic phases of each fish. The short axis of the ventricle was used for quantification. (A–C) Analyses were performed on embryos from three independent clutches per genotype. (B,C) Significance was determined by an unpaired t-test. Error bars correspond to SEM. (D) Adult cardiac morphology at 24 months post fertilization (mpf). Scale bars = 500 µm. (a–c) Representative brightfield images of dissected fish hearts. (d–f) Histology was analyzed by H&E staining (n = 5 hearts per genotype). (g–i) Fibrosis was analyzed by MTC staining (n = 5 hearts per genotype). (E) Quantification of ventricular area to body length ratio (VA/BL) reveals significant ventricular enlargement in homozygous tmem43wue4/wue4 zebrafish. Brightfield images represented in (a–c) were used for assessment of ventricular surface area. (F) Quantification of body length reveals normal growth and development in adult tmem43 mutants. (E,F) Significance was determined by one-way ANOVA with Bonferroni’s multiple comparison test, * p ≤ 0.05. Error bars correspond to SEM. PHENOTYPE:
|

ZFIN is incorporating published figure images and captions as part of an ongoing project. Figures from some publications have not yet been curated, or are not available for display because of copyright restrictions. |
|
ZFIN is incorporating published figure images and captions as part of an ongoing project. Figures from some publications have not yet been curated, or are not available for display because of copyright restrictions. EXPRESSION / LABELING:
|
|
ZFIN is incorporating published figure images and captions as part of an ongoing project. Figures from some publications have not yet been curated, or are not available for display because of copyright restrictions. |