
|
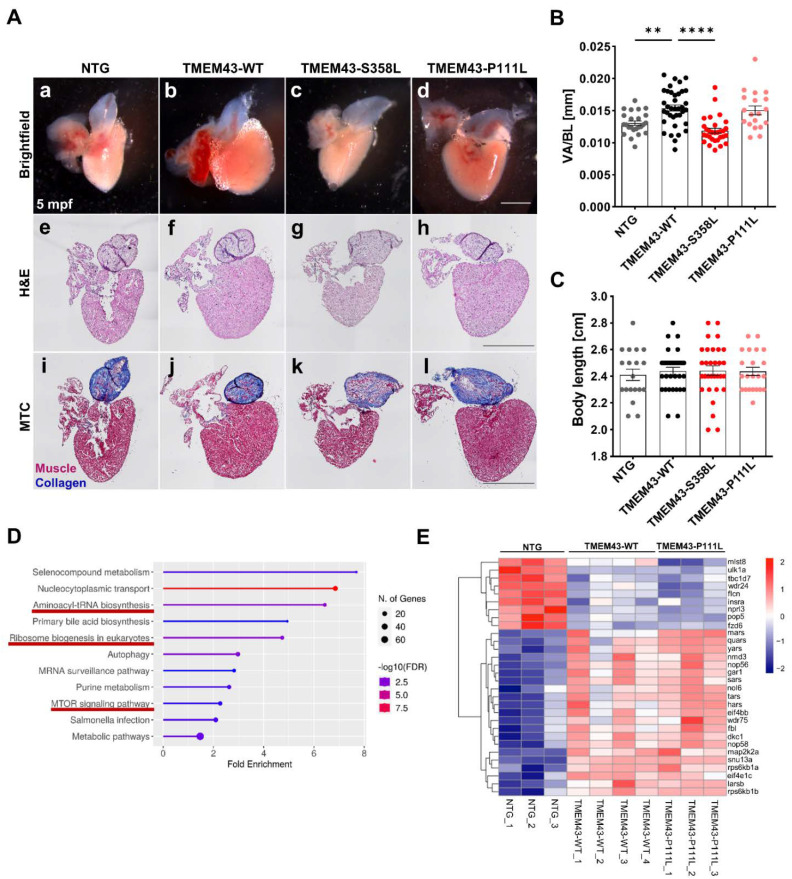
Fig. 5
TMEM43 wild-type (WT) and TMEM43-P111L transgenic lines display enlarged hearts in adult zebrafish. (A) Preserved myocardial structure in adult zebrafish at 5 months post-fertilization (mpf) (n ≥ 5 hearts per genotype). Scale bars = 500 µm. (a–d) Representative brightfield images of dissected fish hearts. (e–h) Histology was analyzed by hematoxylin and eosin (H&E) staining. (i–l) Fibrosis was analyzed by Masson’s Trichrome (MTC) staining. (B) TMEM43-WT and TMEM43-P111L individuals display larger ventricles as indicated by an increased ventricular area to body length ratio (VA/BL) compared to the non-transgenic control (NTG) and TMEM43-S358L. Brightfield images represented in (a–d) were used for assessment of ventricular surface area. (C) Quantification of body length reveals normal growth and development of adult transgenic zebrafish. (D) Kyoto Encyclopedia of Genes and Genomes (KEGG) pathway enrichment analysis for shared differently expressed genes (DEGs) between “NTG vs. TMEM43-WT” and “NTG vs. TMEM43-P111L” (padj ≤ 0.05) using ShinyGO v0.76. The x-axis represents fold enrichment and y-axis represents enriched KEGG terms. The size of the dots represents the number of involved genes. The false discovery rate (FDR) value is indicated by colors.KEGG pathways, which include the DEGs shown in (E), are underlined in red and play a role for cell growth. (E) Heatmap showing DEGs belonging to the KEGG pathways “Aminoacyl-t-RNA biosynthesis”, “Ribosome biogenesis in eukaryotes”, and “mTOR signaling pathways”. (B,C) For all graphs, significance was determined by one-way ANOVA with Bonferroni’s multiple comparison test, ** p ≤ 0.01, **** p ≤ 0.0001. Error bars correspond to SEM.