
Fig. 3
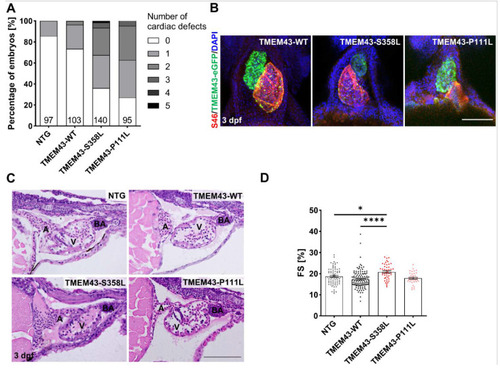
Overexpression of TMEM43 variants induce altered cardiac morphology and function at 3 days post-fertilization (dpf). (A) Visual phenotyping demonstrates the percentage of embryos with zero to five different cardiac-specific defects. The defects were classified into looping defects, pericardial edemas, arrhythmias, altered ventricular shape, strong ventricular contractions, heterogenous ventricular contractions, and altered atrial shape. Both TMEM43 variant lines show an increased percentage of embryos with at least one cardiac defect. The number of phenotyped embryos is indicated at the bottom of the columns. (B) Confocal maximum intensity projections of immunofluorescence-stained hearts. Atria are labeled for S46 localization (red), ventricles for GFP localization (green), and nuclei with DAPI (blue). In contrast to TMEM43-WT hearts, both TMEM43 variant lines display developmental defects (looping defects and reduced ventricular chamber size in TMEM43-S358L, as well as altered atrial chamber shape in TMEM43-P111L). Ventral views, arterial pole to the top. Scale bar = 100 µm. (C) Representative histological images of hematoxylin and eosin-stained sagittal plastic sections showing structurally normal heart chambers and the outflow tract in embryos at 3 dpf (n ≥ 5 per genotype). A, atrium; BA, Bulbus arteriosus; V, ventricle. Scale bar = 100 µm. (D) Analysis of cardiac function by ventricular fractional shortening (FS) quantification from a time series of the embryonic cardiac cycle. Data points represent the average measurement obtained from three diastolic/systolic phases of each fish. The short axis of the ventricle was used for quantification. Significantly increased FS was detected in TMEM43-S358L embryos. Significance was determined by one-way ANOVA with Bonferroni’s multiple comparison test, * p ≤ 0.05, **** p ≤ 0.0001. Error bars correspond to SEM. (A,D) Analyses were performed on embryos from three independent clutches per genotype. |
| Fish: | |
|---|---|
| Observed In: | |
| Stage: | Protruding-mouth |