
- Title
-
auts2 Features and Expression Are Highly Conserved during Evolution Despite Different Evolutionary Fates Following Whole Genome Duplication
- Authors
- Merdrignac, C., Clément, A.E., Montfort, J., Murat, F., Bobe, J.
- Source
- Full text @ Cells
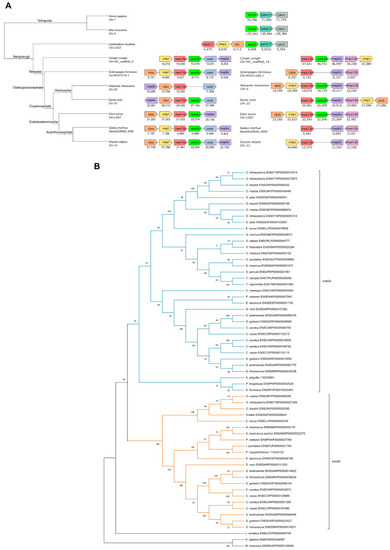
Identification of teleost auts2 ohnologs and their origin using synteny and phylogenetic analysis (A). Identification of teleost auts2a and auts2b in 7 species using synteny analysis. Chromosome and scaffold numbers are indicated. Gene positions are in kilobases. The names of phylogenetic groups are indicated on tree branches. (B). Phylogenetic analysis of full-length Auts2 proteins using CLUSTALW alignment and maximum likelihood method. Protein accession numbers are provided in front of the species names. Bootstrap values are displayed on each node. |
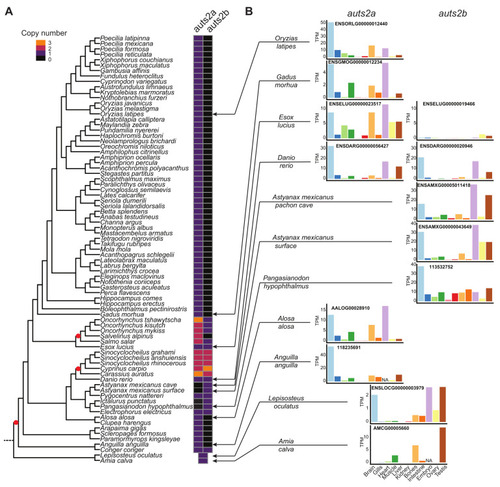
Comprehensive analysis of teleost auts2 gene retention and expression after teleost-specific whole genome duplication. (A). Retention of teleost auts2a and auts2b in 78 species using synteny analysis. Whole genome duplication events are indicated by a red spot. (B). Tissue expression analysis of auts2 using RNA-seq data in 10 species. Different colors correspond to different tissues. |
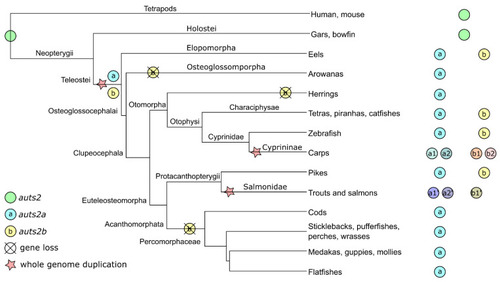
Teleost auts2 ohnologs’ evolutionary history. The presence of a gene in a specific clade denotes the retention in at least one species of the clade. |
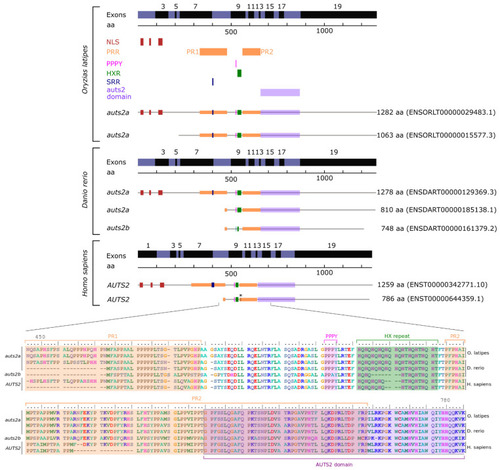
AUTS2 exons and protein domains in humans, zebrafish, and Japanese medaka based on Ensembl. NLS: nuclear localization sequence. PRR: proline-rich repeat domain. PPPY: PPPY protein binding motif. HXR: HX repeat motif. SRR: serine-rich repeat domain. * indicates the position of the initiation codon of the S-AUTS2-Var2 human short C-terminal isoform [4,6]. |
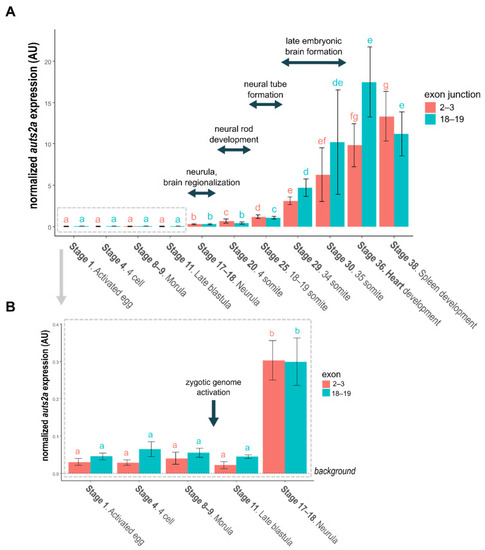
(A). Japanese medaka auts2a expression during embryonic development. (B). Focus on early embryonic development. For both panels bars represent the mean normalized expression calculated using 4 different pools of embryos. The standard deviation is displayed. Primers surrounding exons 2–3 junction target the full-length isoform. Primers surrounding the exons 18–19 junction target both full-length and short C-terminal isoforms. Comparisons were performed independently for each set of primer. Stages sharing the same letter are not significantly different (p < 0.05). |
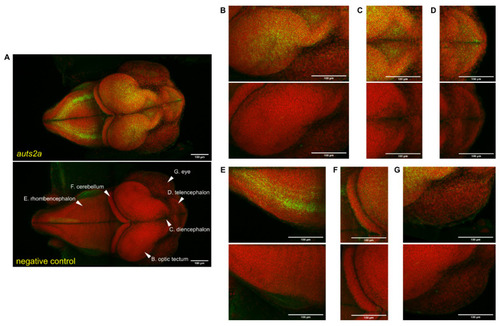
auts2a spatial expression in stage 29 medaka whole embryos using RNAscope. Green staining corresponds to the RNAscope signal. Red staining corresponds to the methyl-green-stained cell nucleus. An RNAscope probe targeting the Bacillus subtilis dapB gene (Accession #: EF191515) was used as a negative control. Images correspond to a maximum intensity Z axis projection for the RNAscope probe and standard deviation Z axis projection for methyl green. (A). Whole embryo. (B). Optic tectum. (C). Diencephalon. (D). Telencephalon. (E). Rhombencephalon. (F). Cerebellum. (G). Eyes. |