
Image
|
Figure Caption
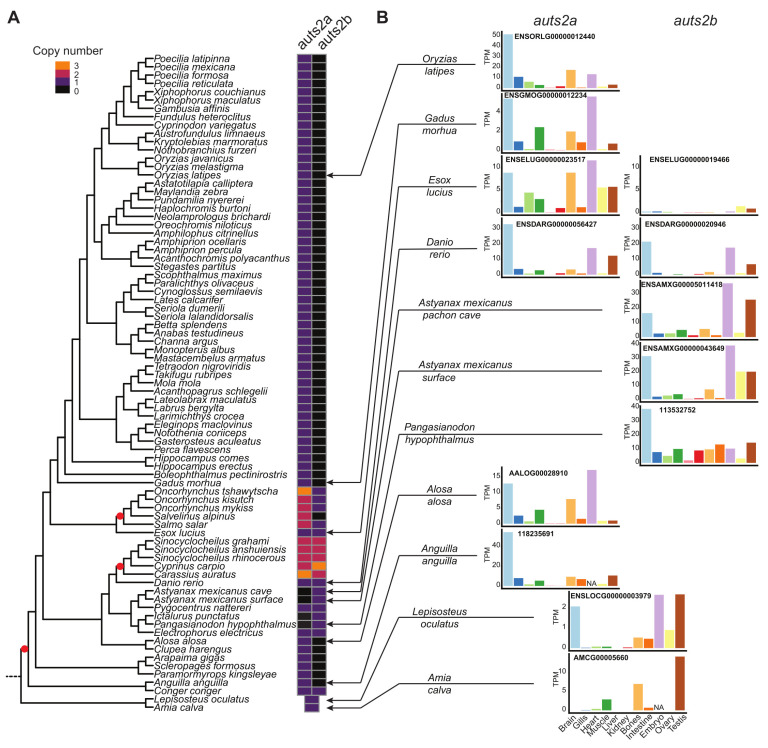
Fig. 2
Comprehensive analysis of teleost auts2 gene retention and expression after teleost-specific whole genome duplication. (A). Retention of teleost auts2a and auts2b in 78 species using synteny analysis. Whole genome duplication events are indicated by a red spot. (B). Tissue expression analysis of auts2 using RNA-seq data in 10 species. Different colors correspond to different tissues.
Acknowledgments
This image is the copyrighted work of the attributed author or publisher, and
ZFIN has permission only to display this image to its users.
Additional permissions should be obtained from the applicable author or publisher of the image.
Full text @ Cells