
Image
|
Figure Caption
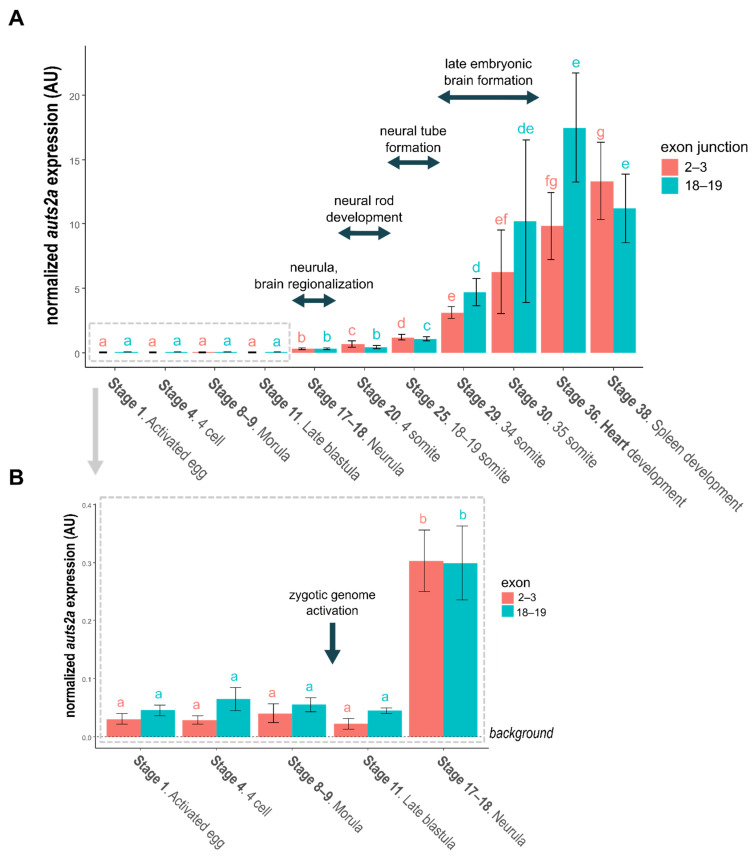
Fig. 5
(A). Japanese medaka auts2a expression during embryonic development. (B). Focus on early embryonic development. For both panels bars represent the mean normalized expression calculated using 4 different pools of embryos. The standard deviation is displayed. Primers surrounding exons 2–3 junction target the full-length isoform. Primers surrounding the exons 18–19 junction target both full-length and short C-terminal isoforms. Comparisons were performed independently for each set of primer. Stages sharing the same letter are not significantly different (p < 0.05).
Acknowledgments
This image is the copyrighted work of the attributed author or publisher, and
ZFIN has permission only to display this image to its users.
Additional permissions should be obtained from the applicable author or publisher of the image.
Full text @ Cells