
- Title
-
A genetic labeling system to study dendritic spine development in zebrafish models of neurodevelopmental disorders
- Authors
- DeMarco, E.C., Stoner, G.R., Robles, E.
- Source
- Full text @ Dis. Model. Mech.
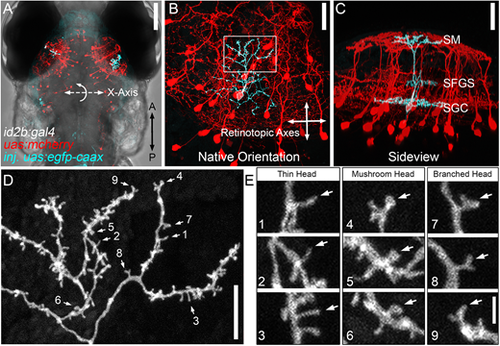
Dendritic spines on PyrN apical dendrites. (A) Dorsal view, whole-brain confocal image volume of an 8 dpf double transgenic Tg(id2b:gal4,uas-e1b:ntr-mCherry) larva injected at the embryo stage with uas:egfp-caax plasmid to generate sparse labeling. Note the single EGFP-labeled PyrN in each tectal lobe. (B) Higher magnification of the maximum projection of neurons labeled in the right tectal lobe of the larva in A. Projection is shown from the dorsal view, with 0° rotation. Note that this view was used for subsequent measurements of dendrite area along the retinotopic axes. (C) Maximum projection of same neuron rotated −50° about the x-axis, to yield an orientation parallel to the tectal layers. Note the clearly stratified neurite morphology with arbors in the SM, SFGS and SGC layers of the tectal neuropil. (D) High magnification view of a subvolume of the SM-targeted dendrite of PyrN in B,C as indicated by the box in B. Note the branched arbor decorated with multiple short protrusions. Numbered arrows indicate spines selected for higher magnification views. (E) 3× magnified views of nine dendritic spines indicated by arrows in D. Note the presence of different types of spine heads: thin, mushroom and branched. Images are representative of 20 PyrNs. Scale bars: 100 µm (A); 25 µm (B,C); 10 µm (D); 1.65 µm (E). EXPRESSION / LABELING:
|
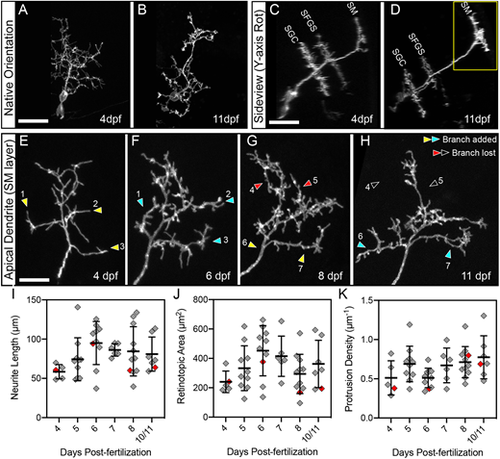
Multi-day imaging of dendrite development and spine formation. (A,B) Native-orientation (dorsal view) maximum-projection images of the same PyrN at 4 dpf and 11 dpf. (C,D) Rotated sideview projections of the neuron in A,B. Three distinct dendritic stratifications are visible at each timepoint. Also note that the total length of the main dendritic process increases, most likely due to thickening of the tectal neuropil during this developmental period. (E-H) Higher magnification views of the SM-targeted apical dendrite of PyrN in A-D (region indicated by the yellow box in D). Sites where new branches are added are indicated by yellow arrowheads (before branch addition) and cyan arrowheads (after branch addition). Sites where branches were retracted are indicated by red arrowheads (before branch retraction) and open arrowheads (after branch retraction). Note that branches are added and retracted throughout this time window. Also note that from 4 to 11 dpf there is a gradual loss of long, filopodial protrusions and an increase in short, spine-like protrusions. (I) Neurite length measurements of PyrN SM dendrites between 4 and 10/11 dpf. Due to reduced survival at the 10 and 11 dpf timepoints, these groups were combined into one bin. (J) Retinotopic area measurements of PyrN SM dendrites between 4 and 10/11 dpf. (K) Spine density measurements of PyrN SM dendrites between 4 and 10/11 dpf. Number of neurons and larvae (indicated in parentheses) analyzed for each timepoint: 5 (5), 10 (10), 10 (10), 6 (6), 11 (11) and 7 (7). All graphs depict mean±s.d. Red diamonds indicate measurements obtained from PyrN dendrite in E-H. One-way ANOVA with Tukey's multiple comparisons test was used to determine significance, P-values for all pairwise comparisons in I, J and K were >0.05. Scale bars: 20 µm (A-D); 5 µm (E-H). |
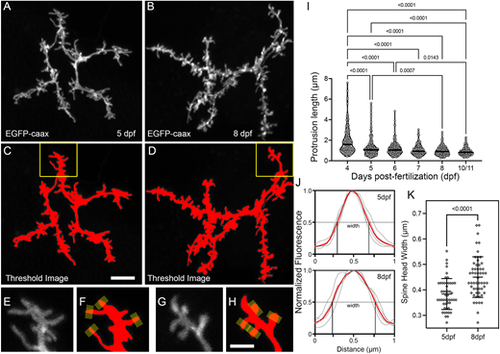
Morphological changes associated with the filopodia-spine transition. (A,B) Maximum projections of apical dendrite subvolumes acquired from a 5 dpf PyrN (A) and an 8 dpf PyrN (B). (C,D) Examples of images in A,B with a low threshold mask applied. (E-H) Magnified views of dendrite subregions indicated by yellow boxes in C and D. Grayscale (E,G) and thresholded (F,H) images are presented for each region. Yellow rectangles at spine tips in F,H indicate 0.5 µm-wide line selections used to generate fluorescence intensity plots across each spine head. (I) Quantification of protrusion lengths for PyrN apical dendrites at 4, 5, 6, 7, 8 and 10/11 dpf. Note gradual decrease in protrusions with lengths greater than 2 µm. The median for each group is indicated by a horizontal line. Number of spines and neurons (indicated in parentheses) analyzed at each timepoint: 123 (6), 225 (7), 214 (7), 137 (5), 187 (5) and 157 (4). One-way ANOVA with Tukey's multiple comparisons test was used to determine significance. All significant differences (P<0.05) are shown on graph. (J) Spine head fluorescence intensity plots for measuring spine head widths. Thin gray traces are for the four spines indicated in F and H. Width was calculated by measuring the width at half-maximum for each trace. The means of these widths for each set is indicated by red traces. (K) Comparison of spine head widths at 5 and 8 dpf. Number of spines and neurons (indicated in parentheses) analyzed at 5 and 8 dpf: 50 (4) and 55 (4). Data are presented as mean±s.d. Significance was determined using a two-tailed unpaired t-test. Scale bars: 5 µm (A-D); 2 µm (E-H). |
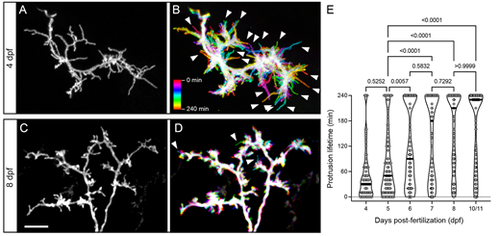
Developmental changes in protrusion stability. (A) High magnification view of the SM-targeted apical dendrite of a 4 dpf PyrN. Note the abundance of long, filopodial protrusions. (B) Temporal color-coded image of the dendrite in A during a 4 h time-lapse recording with image stacks acquired every 10 min. The color scale indicates which image corresponds to each timepoint. Note the prevalence of motile protrusions with a single-color label, indicating that they were present at that position during a single acquisition (arrowheads). (C) High magnification view of the SM-targeted apical dendrite of an 8 dpf PyrN. Note the abundance of short, spine-like protrusions. (D) Temporal color-coded image of the dendrite in C during a 4 h time-lapse recording with image volumes acquired every 10 min. Note the relatively small number of filopodia-like motile protrusions generated (arrowheads). (E) Comparison of protrusion lifetimes at 4, 5, 6, 7, 8 and 10/11 dpf. Note the gradual increase in stable protrusions (240 min lifetimes) and decrease in transient spines lasting less than 120 min. The horizontal lines on the violin plots indicate median values for each group. One-way ANOVA with Tukey's multiple comparisons test was used to determine significance. Significant differences not shown on graph: 4 dpf versus 6 dpf, P<0.0001; 4 dpf versus 7 dpf, P<0.0001; 4 dpf versus 8 dpf, P<0.0001; 4 dpf versus 10/11 dpf, P<0.0001; 6 dpf versus 8 dpf, P=0.015; and 6 dpf versus 10/11 dpf, P=0.0154. Number of spines and neurons (indicated in parentheses) analyzed at each timepoint: 73 (4), 91 (5), 99 (4), 83 (4), 123 (4) and 110 (4). Scale bar: 5 µm. |
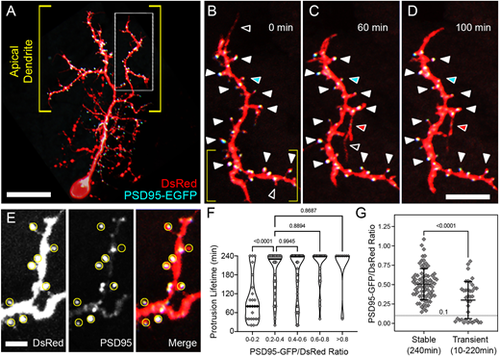
PSD95-EGFP dynamics in PyrN apical dendrites. (A) Native orientation view of a 6 dpf PSD95-EGFP/DsRed-labeled PyrN. (B-D) Time-lapse images of PSD95-EGFP localization in a dendrite subregion, as indicated by the boxed region in A. White arrowheads mark seven PSD95-positive spines that were present during the entire 4 h recording. For clarity, some stable spines with PSD95 accumulations are not marked by arrowheads. Open arrowheads indicate PSD95-negative protrusions that were retracted during the time-lapse imaging. Red arrowheads indicate a protrusion that extended, formed a PSD95-EGFP punctum and was stabilized from 60 to 100 min. Cyan arrowheads indicate a spine containing a PSD95 punctum that was retracted while the punctum persisted. (E) Magnified view of subregion indicated by the yellow brackets in B. DsRed (left), PSD95-EGFP (middle) and merged (right) fluorescence channels are shown separately. Yellow circles indicate regions of interest used to calculate PSD95-EGFP/DsRed signal ratios. Note the wide range of PSD95-EGFP intensities within the analysis regions (middle and right panels). (F) Quantification of protrusion lifetimes for spines binned into groups based on their degree of PSD95-EGFP enrichment (PSD95-EGFP/DsRed ratio). Note that there is a wide range of lifetimes for protrusions with the lowest PSD95-EGFP enrichment (ratios from 0-0.2), whereas the majority of protrusions with intermediate (0.2-0.6) or high (>0.6) PSD95-EGFP enrichment values were stable during the 4 h recording. The median for each group is indicated with a horizontal line. One-way ANOVA with Tukey's multiple comparisons test was used to determine significance. Significant differences not shown on graph: 0-0.2 versus 0.4-0.6, P<0.0001; 0-0.2 versus 0.6-0.8, P<0.0001; 0-0.2 versus >0.8, P<0.0001. Analysis was performed on 156 protrusions from five neurons. (G) Comparison of PSD95-EGFP/DsRed ratios between stable and transient protrusions. Note that both groups have many spines with intermediate values, but only the stable group has several spines with ratios >0.8. Conversely, only the transient group contains protrusions with ratios <0.1. Data are shown as mean±s.d. Two-tailed unpaired t-test was used to determine significance. Scale bars: 20 µm (A); 8 µm (B-D); 2.5 µm (E). EXPRESSION / LABELING:
|
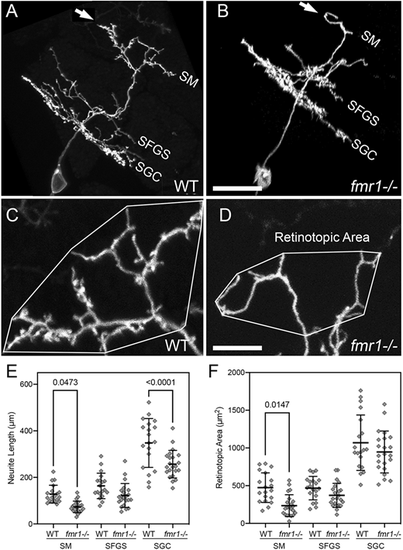
fmr1 mutants exhibit defects in PyrN dendrite development. (A,B) Sideview rotated image volumes of a PyrN in a WT 8 dpf larva (A) and an 8 dpf fmr1−/− larva. Note three distinct dendrite stratifications in layers SM, SFGS and SGC. Arrows in A and B indicate the apical dendrite. (C,D) Native orientation view (dorsal side up, as in Fig. 1B) of the SM-targeted apical dendrites in the two PyrNs shown in A,B. Convex polygons overlayed on the arbor demonstrate how the retinotopic area was calculated. Note the reduction in dendrite length and area, as well as very few spines on the fmr1 mutant dendrite. (E) Dendrite arbor-specific neurite length measurements in WT versus fmr1 mutants. Note significant reductions for the SM and SGC arbor in the mutant. (F) Retinotopic measurements in WT versus fmr1 mutants. Note the significant reduction in retinotopic area only for the SM dendrite arbor in fmr1 mutants. Data are shown as mean±s.d. One-way ANOVA with Tukey's multiple comparisons test was used to determine significance. Analysis performed on 19 PyrNs in 16 WT larvae and 22 PyrNs in 19 fmr1 mutant larvae. Scale bars: 15 µm (A,B); 5 µm (C,D). PHENOTYPE:
|
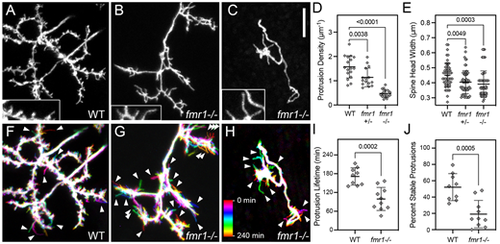
Reduced spine density, head width and stability in fmr1 mutants. (A) Native orientation maximum-projection image (dorsal side up, as in Fig. 1B) of the SM-targeted apical dendrites in an 8 dpf WT larva. (B,C) Native orientation views of the SM-targeted apical dendrites from two 8 dpf fmr1−/− mutant larvae. These are representative of mild (B) and severe (C) phenotypes observed in the fmr1 mutants. Insets in A-C are 1.5× magnified views of subregions containing spines. Note that the WT has both thin and wide heads, whereas the majority of spines on fmr1−/− PyrNs have thin heads. (D,E) Quantification of spine density and spine head width for WT, fmr1 heterozygotes (fmr1+/−) and fmr1 homozygotes (fmr1−/−). Both measurements were made using static single maximum-projection images as those shown in (A-C). Note significant decreases in both density and head width in the fmr1 mutants. One-way ANOVA with Tukey's multiple comparisons test was used to determine significance. Number of neurons analyzed for protrusion density analysis in WT, fmr1+/− and fmr1−/−: 17, 15 and 17, respectively. Number of spines and neurons (indicated in parentheses) analyzed for head width analysis in WT, fmr1+/− and fmr1−/−: 55 (4), 65 (6) and 58 (4), respectively. (F-H) Temporal color-coded image of dendrites in A-C during 4 h time-lapse recordings with image volumes acquired every 10 min. Color scale in H applies to all three images and indicates the images corresponding to each timepoint. Note increased number of transient protrusions (single-color label indicating that they were present during a single timepoint) in fmr1 mutants compared to WT (arrowheads). (I,J) Quantification of the protrusion lifetime and percentage of stable protrusions obtained from 4 h time-lapse recordings with a 10 min acquisition interval. On average, PyrN apical dendrites in fmr1 mutant larvae had reduced protrusion lifetimes (I), an effect largely due to a significant reduction in the percentage of stable protrusions present for the entire 4 h time-lapse imaging. Data are shown as mean±s.d. P-values were obtained using two-tailed unpaired t-tests. Analysis was performed on nine PyrNs in nine WT larvae and ten PyrNs in ten fmr1−/− mutant larvae. Scale bar: 5 µm. PHENOTYPE:
|