
Fig. 7
- ID
- ZDB-FIG-220822-15
- Publication
- DeMarco et al., 2022 - A genetic labeling system to study dendritic spine development in zebrafish models of neurodevelopmental disorders
- Other Figures
- All Figure Page
- Back to All Figure Page
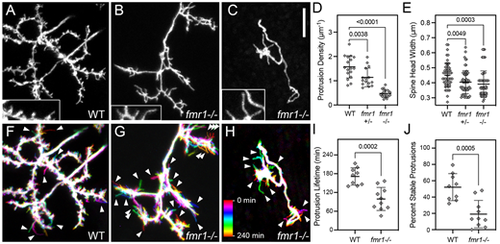
Reduced spine density, head width and stability in fmr1 mutants. (A) Native orientation maximum-projection image (dorsal side up, as in Fig. 1B) of the SM-targeted apical dendrites in an 8 dpf WT larva. (B,C) Native orientation views of the SM-targeted apical dendrites from two 8 dpf fmr1−/− mutant larvae. These are representative of mild (B) and severe (C) phenotypes observed in the fmr1 mutants. Insets in A-C are 1.5× magnified views of subregions containing spines. Note that the WT has both thin and wide heads, whereas the majority of spines on fmr1−/− PyrNs have thin heads. (D,E) Quantification of spine density and spine head width for WT, fmr1 heterozygotes (fmr1+/−) and fmr1 homozygotes (fmr1−/−). Both measurements were made using static single maximum-projection images as those shown in (A-C). Note significant decreases in both density and head width in the fmr1 mutants. One-way ANOVA with Tukey's multiple comparisons test was used to determine significance. Number of neurons analyzed for protrusion density analysis in WT, fmr1+/− and fmr1−/−: 17, 15 and 17, respectively. Number of spines and neurons (indicated in parentheses) analyzed for head width analysis in WT, fmr1+/− and fmr1−/−: 55 (4), 65 (6) and 58 (4), respectively. (F-H) Temporal color-coded image of dendrites in A-C during 4 h time-lapse recordings with image volumes acquired every 10 min. Color scale in H applies to all three images and indicates the images corresponding to each timepoint. Note increased number of transient protrusions (single-color label indicating that they were present during a single timepoint) in fmr1 mutants compared to WT (arrowheads). (I,J) Quantification of the protrusion lifetime and percentage of stable protrusions obtained from 4 h time-lapse recordings with a 10 min acquisition interval. On average, PyrN apical dendrites in fmr1 mutant larvae had reduced protrusion lifetimes (I), an effect largely due to a significant reduction in the percentage of stable protrusions present for the entire 4 h time-lapse imaging. Data are shown as mean±s.d. P-values were obtained using two-tailed unpaired t-tests. Analysis was performed on nine PyrNs in nine WT larvae and ten PyrNs in ten fmr1−/− mutant larvae. Scale bar: 5 µm. |
| Fish: | |
|---|---|
| Observed In: | |
| Stage: | Days 7-13 |