
|
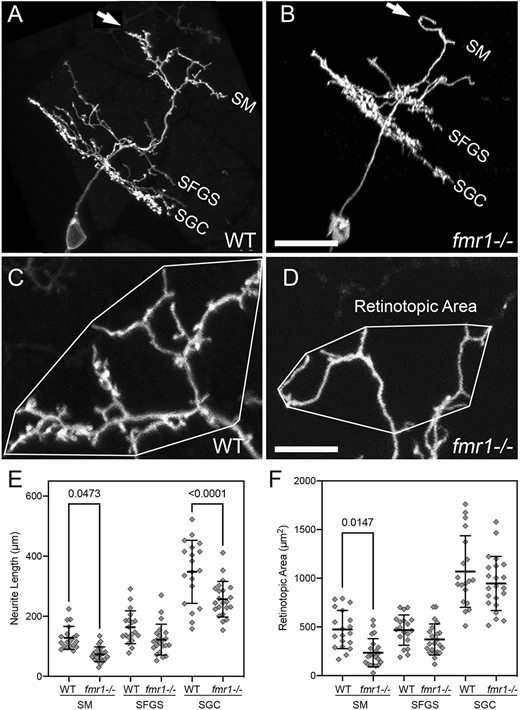
Fig. 6
fmr1 mutants exhibit defects in PyrN dendrite development. (A,B) Sideview rotated image volumes of a PyrN in a WT 8 dpf larva (A) and an 8 dpf fmr1−/− larva. Note three distinct dendrite stratifications in layers SM, SFGS and SGC. Arrows in A and B indicate the apical dendrite. (C,D) Native orientation view (dorsal side up, as in Fig. 1B) of the SM-targeted apical dendrites in the two PyrNs shown in A,B. Convex polygons overlayed on the arbor demonstrate how the retinotopic area was calculated. Note the reduction in dendrite length and area, as well as very few spines on the fmr1 mutant dendrite. (E) Dendrite arbor-specific neurite length measurements in WT versus fmr1 mutants. Note significant reductions for the SM and SGC arbor in the mutant. (F) Retinotopic measurements in WT versus fmr1 mutants. Note the significant reduction in retinotopic area only for the SM dendrite arbor in fmr1 mutants. Data are shown as mean±s.d. One-way ANOVA with Tukey's multiple comparisons test was used to determine significance. Analysis performed on 19 PyrNs in 16 WT larvae and 22 PyrNs in 19 fmr1 mutant larvae. Scale bars: 15 µm (A,B); 5 µm (C,D).