
- Title
-
Comparative Morphological, Metabolic and Transcriptome Analyses in elmo1-/- , elmo2-/- , and elmo3-/- Zebrafish Mutants Identified a Functional Non-Redundancy of the Elmo Proteins
- Authors
- Boger, M., Bennewitz, K., Wohlfart, D.P., Hausser, I., Sticht, C., Poschet, G., Kroll, J.
- Source
- Full text @ Front Cell Dev Biol
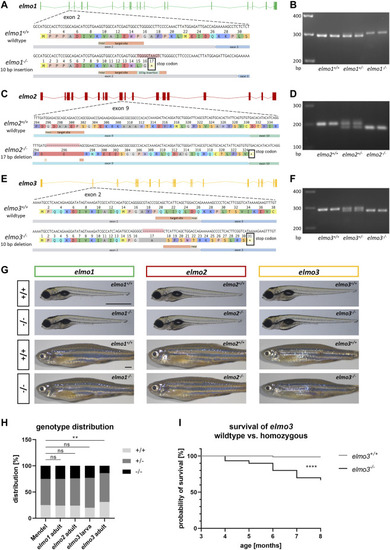
Generation of elmo1, elmo2 and elmo3 knockout zebrafish lines. (A) Exon map of the zebrafish elmo1 gene and the position of the CRISPR target site designed for zebrafish elmo1 targeting exon 2. Sequencing results of cDNA sequence and the resulting amino acid sequence from elmo1 +/+ and the generated elmo1 −/− line with a 10 bp insertion. The resulting stop codon is indicated with a star. (B) The 10 base pair insertion in elmo1 was confirmed on RNA level by gel electrophoretic segregation of PCR products of cDNA which was synthesized from mRNA from elmo1 +/+ , elmo1 +/− and elmo1 −/− larvae at 120 hpf. PCR product size: wild type 298 bp, homozygous 308 bp. (C) Exon map of the zebrafish elmo2 gene and the position of the CRISPR target site designed for zebrafish elmo2 targeting exon 9. Sequencing results of cDNA sequence and the resulting amino acid sequence from elmo2 +/+ and the generated elmo2 −/− line with a 17 bp deletion. The resulting stop codon is indicated with a star. (D) The 17 base pair deletion in elmo2 was confirmed on RNA level by gel electrophoretic segregation of PCR products of cDNA which was synthesized from mRNA from elmo2 +/+ , elmo2 +/- and elmo2 −/− larvae at 120 hpf. PCR product size: wild type 198 bp, homozygous 181 bp. (E) Exon map of the zebrafish elmo3 gene and the position of the CRISPR target site designed for zebrafish elmo3 targeting exon 2. Sequencing results of cDNA sequence and the resulting amino acid sequence from elmo3 +/+ and the generated elmo3 −/− line with a 10 bp deletion. The resulting stop codon is indicated with a star. (F) The 10 base pair deletion in elmo3 was confirmed on RNA level by gel electrophoretic segregation of PCR products of cDNA which was synthesized from mRNA from elmo3 +/+ , elmo3 +/− , and elmo3 −/− larvae at 120 hpf. PCR product size: wild type 290 bp, homozygous 280 bp. (G) Representative light microscopy pictures of larvae at 120 hpf and adults (8–13 mpf) of elmo1 +/+ , elmo1 −/− , elmo2 +/+ , elmo2 −/− , elmo3 +/+ , and elmo3 −/− zebrafish. Scale bar is 1 mm. (H) Genotype distribution of Mendelian inheritance and the filial generation of elmo1 (n = 358), elmo2 (n = 354) and elmo3 (n larva = 100, n adult = 224) after heterozygous inter se crossings. Age of adults was 3 mpf and age of larvae was 120 hpf. The genotype distribution in elmo3 adults was altered to the Mendelian inheritance. (I) Reduced survival rate of adult elmo3 −/− (n = 30) compared to elmo3 +/+ (n = 74) zebrafish over the age of 3–8 months. Statistical analysis was done with chi-square test and logrank test. **p < 0.01, ****p < 0.0001. ns, not significant; bp, base pair; hpf, hours post fertilization; mpf, months post fertilization. PHENOTYPE:
|

The loss of Elmo1 and Elmo3, respectively, led to an increased diameter of hyaloid blood vessels in zebrafish larvae. (A) Quantification of larval hyaloid vasculature at 120 hpf showed no changes in branches and sprouts but an increase in the vessel diameter in elmo1 −/− compared to elmo1 +/+ . n = 33–37 hyaloids per group. (B) Quantification of larval hyaloid vasculature at 120 hpf showed no changes in branches, sprouts and vessel diameter in elmo2 −/− compared to elmo2 +/+ . n = 33 hyaloids per group. (C) Quantification of larval hyaloid vasculature at 120 hpf showed no changes in branches and sprouts but an increase in the vessel diameter in elmo3 −/− compared to elmo3 +/+ . n = 27–31 hyaloids per group. (D–F) Representative confocal microscopy images of the hyaloid vasculature of elmo1 +/+ and elmo1 −/− (D), elmo2 +/+ and elmo2 −/− (E) and elmo3 +/+ and elmo3 −/− (F) zebrafish larvae at 120 hpf. Scale bar is 50 µm. Statistical analysis was done with t-test and Mann-Whitney test. *p < 0.05, **p < 0.01. ns, not significant; hpf, hours post fertilization. PHENOTYPE:
|
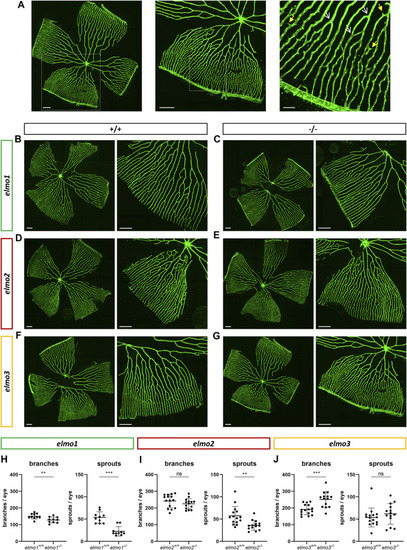
Different regulation of the retinal vasculature through Elmo1, Elmo2 and Elmo3 in adult zebrafish. (A) Exemplary pictures of a confocal scan of an adult zebrafish retinal vasculature. White squares each indicate the section of the image on the right. Scale bars are 200 µm (left, middle) and 50 µm (right). Representative vascular branches are indicated with a yellow arrow with a full arrowhead and sprouts are indicated with a white arrow with an open arrowhead. (B–G) Representative confocal microscopy images of the retina vasculature of elmo1 +/+ (B) and elmo1 −/− (C), elmo2 +/+ (D) and elmo2 −/− (E) and elmo3 +/+ (F) and elmo3 −/− (G) adult zebrafish. (H) Quantification of the adult retina vasculature showed a decrease in branches and sprouts in elmo1 −/− compared to elmo1 +/+ . n = 10 retinae per group. (I) Quantification of the adult retina vasculature showed no changes in branches and a decrease in sprouts in elmo2 −/− compared to elmo2 +/+ . n = 14–15 retinae per group. (J) Quantification of the adult retina vasculature showed an increase in branches and no changes in sprouts in elmo3 −/− compared to elmo3 +/+ . n = 14–16 retinae per group. Analyzed retinae were obtained from animals of 9–15 mpf. Scale bar is 200 µm. Statistical analysis was done with t-test and Mann-Whitney test. **p < 0.01, ***p < 0.001. ns, not significant; mpf, months post fertilization. PHENOTYPE:
|
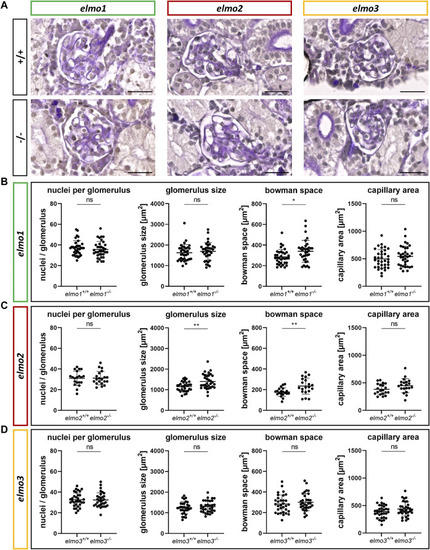
Different regulation of the glomerular structure through Elmo1, Elmo2 and Elmo3 in the kidney of adult zebrafish. (A) Representative light microscopy images of PAS stained sections of glomeruli in the kidney of elmo1 +/+ and elmo1 −/− , elmo2 +/+ and elmo2 −/− and elmo3 +/+ and elmo3 −/− adult zebrafish (9–13 mpf). Scale bar is 20 µm. (B) Analysis of the glomerulus structure in adult zebrafish kidneys showed no changes in the number of nuclei, glomerulus size and capillary area but an increase in the bowman space in elmo1 −/− compared to elmo1 +/+ . n = 35 glomeruli per group, always seven glomeruli per kidney. (C) Analysis of the glomerulus structure in adult zebrafish kidneys showed no changes in the number of nuclei and the capillary area but an increase in glomerulus size and bowman space in elmo2 −/− compared to elmo2 +/+ . n = 20 glomeruli per group, always five per kidney. (D) Analysis of the glomerulus structure in adult zebrafish kidneys showed no alterations in elmo3 −/− compared to elmo3 +/+ . n = 32 glomeruli per group, always eight per kidney. Statistical analysis was done with t-test and Mann-Whitney test. *p < 0.05, **p < 0.01. ns, not significant; mpf, months post fertilization. PHENOTYPE:
|

The loss of Elmo3 led to a thickening of the glomerular basement membrane in adult zebrafish kidneys. (A) Quantification of the thickness of the GBM in the adult kidney (9–15 mpf) showed no alterations in elmo1 −/− compared to littermate elmo1 +/+ . n = 14–17 per group. Each is the mean thickness per one glomerulus. (B) Quantification of the thickness of the GBM in the adult kidney showed no alterations in elmo2 −/− compared to littermate elmo2 +/+ . n = 12–13 per group. Each is the mean thickness per one glomerulus. (C) Quantification of the thickness of the GBM in the adult kidney showed an increase of the GBM thickness in elmo3 −/− compared to littermate elmo3 +/+ . n = 9–10 per group. Each is the mean thickness per one glomerulus (D–F) Representative electron microscopy images of glomerulus sections of adult zebrafish kidneys of elmo1 +/+ and elmo1 −/− (D), elmo2 +/+ and elmo2 −/− (E) and elmo3 +/+ and elmo3 −/− (F). Exemplarily glomerulus compartments as GBM (arrow), Bowman space (B), endothelial cell nucleus (N), capillary lumen (L), podocyte (P) and erythrocyte (E) are indicated in white. Scale bar is 2 µm. Statistical analysis was done with t-test and Mann-Whitney test. **p < 0.01. ns, not significant; GBM, glomerular basement membrane; mpf, months post fertilization. PHENOTYPE:
|

The loss of Elmo1 led to altered blood glucose levels in adult zebrafish. (A) Whole body glucose levels were not changed in elmo1 −/− compared to elmo1 +/+ at 120 hpf. n = 8 samples per group, each containing 20 zebrafish larvae. (B) Fasting blood glucose levels were decreased in adult elmo1 −/− . (C) Postprandial blood glucose levels were increased in adult elmo1 −/− . (D) Whole body glucose levels were not changed in elmo2 −/− compared to elmo2 +/+ at 120 hpf. n = 6 samples per group, each containing 20 zebrafish larvae. (E,F) Fasting and postprandial blood glucose levels were unaltered in adult elmo2 −/− . (G) Whole body glucose levels were not changed in elmo3 −/− compared to elmo3 +/+ at 120 hpf. n = 9 samples per group, each containing 20 zebrafish larvae. (H,I) Fasting and postprandial blood glucose levels were unaltered in adult elmo3 −/− . Blood glucose was obtained from animals of 7–15 mpf. Statistical analysis was done with t-test and Mann-Whitney test. *p < 0.05, **p < 0.01. ns, not significant; hpf, hours post fertilization; mpf, months post fertilization. |
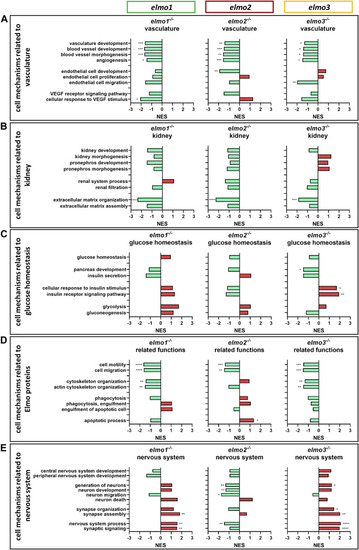
The loss of Elmo1, Elmo2 and Elmo3 led to similar and different changes in the regulation of the transcriptome in larval zebrafish. Comparison of the regulation of cell mechanisms in elmo1 −/− , elmo2 −/− and elmo3 −/− zebrafish larvae, respectively, compared to elmo1 +/+ , elmo2 +/+ and elmo3 +/+ . Gene Ontology Biological Process (GOBP) based analysis of cell mechanisms of the transcriptome using RNA-sequencing data from zebrafish larvae at 120 hpf. n = 6 samples per genotype, each containing 30 zebrafish larvae. Regulation of the gene sets is given as normalized enrichment score (NES). (A) Cell mechanisms related to vascular development were generally downregulated in elmo1 −/− , elmo2 −/− and elmo3 −/− . (B) Cell mechanisms related to kidney development and function showed a downregulation of extracellular matrix organization in elmo1 −/− , elmo2 −/− and elmo3 −/− . (C) Cell mechanisms related to glucose homeostasis were differently regulated in elmo3 −/− . (D) Cell mechanisms related to further functions of Elmo proteins showed a general downregulation in elmo1 −/− and elmo3 −/− and different changes in elmo2 −/− . (E) Cell mechanisms related to the nervous system were generally upregulated in elmo1 −/− and elmo3 −/− and downregulated in elmo2 −/− . hpf, hours post fertilization; NES, normalized enrichment score. |
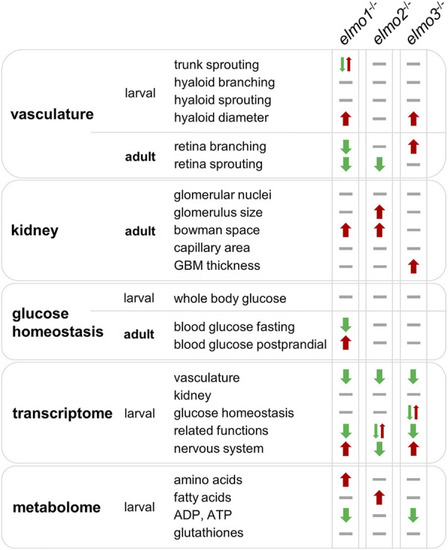
Comparison of elmo1 −/− , elmo2 −/− and elmo3 −/− phenotype in zebrafish indicates different functions of Elmo1, Elmo2 and Elmo3. Overview and comparison of the results of the phenotypical analysis of elmo1 −/− , elmo2 −/− and elmo3 −/− zebrafish in larval and adult stages indicate that Elmo1, Elmo2 and Elmo3 have not the same role in the regulation of the organism. Listed are all fields which were analyzed in this study and their outcome in the specific zebrafish line. Results are visualized with arrows and bars. Arrow up (red) indicates an increase, arrow down (green) indicates a decrease, one arrow up and one arrow down at once indicate different changes, bar (grey) indicates no change. GBM, glomerular basement membrane. PHENOTYPE:
|

ZFIN is incorporating published figure images and captions as part of an ongoing project. Figures from some publications have not yet been curated, or are not available for display because of copyright restrictions. |
|
ZFIN is incorporating published figure images and captions as part of an ongoing project. Figures from some publications have not yet been curated, or are not available for display because of copyright restrictions. |
|
ZFIN is incorporating published figure images and captions as part of an ongoing project. Figures from some publications have not yet been curated, or are not available for display because of copyright restrictions. PHENOTYPE:
|
|
ZFIN is incorporating published figure images and captions as part of an ongoing project. Figures from some publications have not yet been curated, or are not available for display because of copyright restrictions. PHENOTYPE:
|