
|
Fig. 1
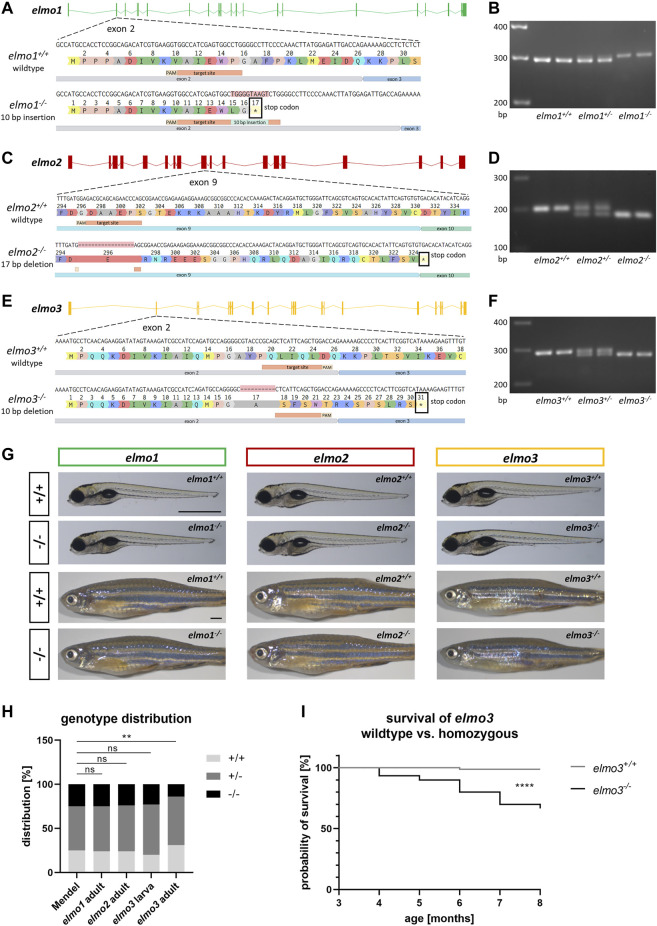
Generation of elmo1, elmo2 and elmo3 knockout zebrafish lines. (A) Exon map of the zebrafish elmo1 gene and the position of the CRISPR target site designed for zebrafish elmo1 targeting exon 2. Sequencing results of cDNA sequence and the resulting amino acid sequence from elmo1 +/+ and the generated elmo1 −/− line with a 10 bp insertion. The resulting stop codon is indicated with a star. (B) The 10 base pair insertion in elmo1 was confirmed on RNA level by gel electrophoretic segregation of PCR products of cDNA which was synthesized from mRNA from elmo1 +/+ , elmo1 +/− and elmo1 −/− larvae at 120 hpf. PCR product size: wild type 298 bp, homozygous 308 bp. (C) Exon map of the zebrafish elmo2 gene and the position of the CRISPR target site designed for zebrafish elmo2 targeting exon 9. Sequencing results of cDNA sequence and the resulting amino acid sequence from elmo2 +/+ and the generated elmo2 −/− line with a 17 bp deletion. The resulting stop codon is indicated with a star. (D) The 17 base pair deletion in elmo2 was confirmed on RNA level by gel electrophoretic segregation of PCR products of cDNA which was synthesized from mRNA from elmo2 +/+ , elmo2 +/- and elmo2 −/− larvae at 120 hpf. PCR product size: wild type 198 bp, homozygous 181 bp. (E) Exon map of the zebrafish elmo3 gene and the position of the CRISPR target site designed for zebrafish elmo3 targeting exon 2. Sequencing results of cDNA sequence and the resulting amino acid sequence from elmo3 +/+ and the generated elmo3 −/− line with a 10 bp deletion. The resulting stop codon is indicated with a star. (F) The 10 base pair deletion in elmo3 was confirmed on RNA level by gel electrophoretic segregation of PCR products of cDNA which was synthesized from mRNA from elmo3 +/+ , elmo3 +/− , and elmo3 −/− larvae at 120 hpf. PCR product size: wild type 290 bp, homozygous 280 bp. (G) Representative light microscopy pictures of larvae at 120 hpf and adults (8–13 mpf) of elmo1 +/+ , elmo1 −/− , elmo2 +/+ , elmo2 −/− , elmo3 +/+ , and elmo3 −/− zebrafish. Scale bar is 1 mm. (H) Genotype distribution of Mendelian inheritance and the filial generation of elmo1 (n = 358), elmo2 (n = 354) and elmo3 (n larva = 100, n adult = 224) after heterozygous inter se crossings. Age of adults was 3 mpf and age of larvae was 120 hpf. The genotype distribution in elmo3 adults was altered to the Mendelian inheritance. (I) Reduced survival rate of adult elmo3 −/− (n = 30) compared to elmo3 +/+ (n = 74) zebrafish over the age of 3–8 months. Statistical analysis was done with chi-square test and logrank test. **p < 0.01, ****p < 0.0001. ns, not significant; bp, base pair; hpf, hours post fertilization; mpf, months post fertilization.