FIGURE SUMMARY
Title

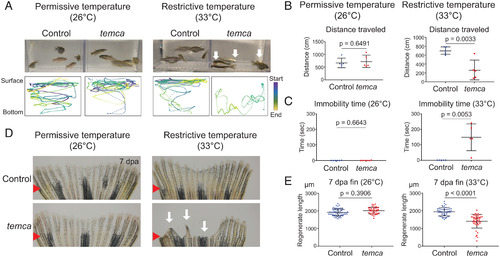
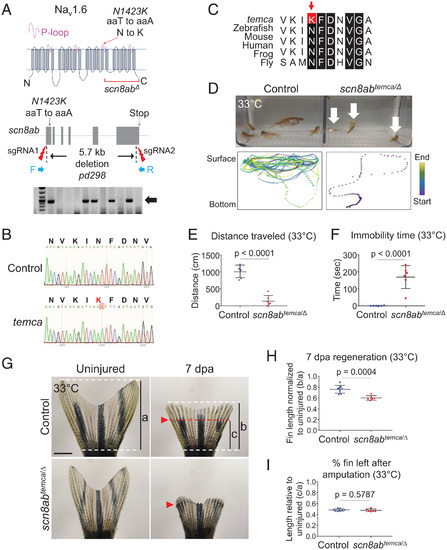
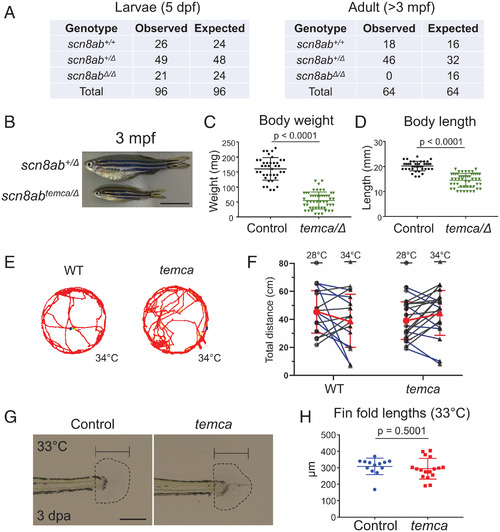
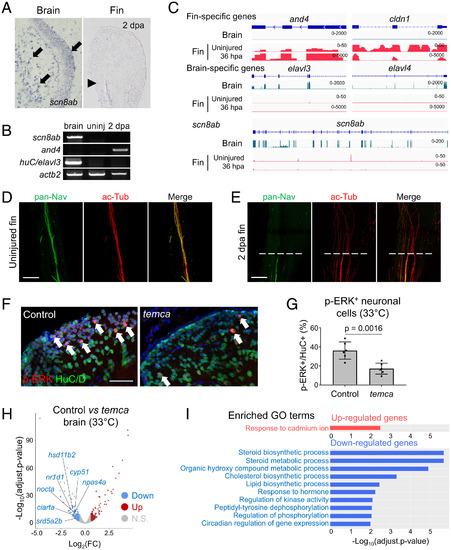
Voltage-gated sodium channel scn8a is required for innervation and regeneration of amputated adult zebrafish fins

Authors
Osorio-Méndez, D., Miller, A., Begeman, I.J., Kurth, A., Hagle, R., Rolph, D., Dickson, A.L., Chen, C.H., Halloran, M., Poss, K.D., Kang, J.
Source
Full text @ Proc. Natl. Acad. Sci. USA

The temca mutants display temperature-sensitive locomotion and fin-regeneration defects. (A) Swimming behavior of control (wild-type siblings) and temca at 26 °C (Left) and 33 °C (Right). (Bottom) Representative 1-min swimming trajectories of individual fish. Color code indicates video frame, and the distance between dots indicates speed. (B and C) Quantification of 3-min swimming behavior of control and temca mutants at 26 °C (Left) and 33 °C (Right). (B) Average distance traveled (n = 5). (C) Duration of immobility at the bottom of swimming tanks (n = 5). (D) Representative whole-mount images of control and temca 7 dpa fins at 26 °C (Left) and 33 °C (Right). White arrows indicate impaired fin regenerates of temca mutants. Red arrows indicate amputation plane. (E) Quantification of fin-regenerate lengths at 7 dpa at 26 °C (n = 62 and 39 for control and temca, respectively) and 33 °C (n = 51 and 43 for control and temca, respectively). Data are presented as mean ± SD. Student’s unpaired two-tailed t test.

temca Encodes the VGSC alpha subunit, scn8ab. (A, Top) Schematic of Scn8ab (Nav1.6) protein structure. Red arrow points to temca mutation in pore-loop (P-loop) of the third domain. Deleted region of scn8ab deletion allele (scn8abΔ) is shown. (Middle) sgRNA target sites are depicted for 5.7-kb deletion of scn8ab and primers used to confirm deletion. (Bottom) A representative DNA gel image indicating scn8abΔ is shown. (B) Sanger sequencing chromatograms from control (wild-type siblings) and temca. The temca mutation within the scn8ab coding sequence causes an asparagine (N) to lysine (K) change. (C) Amino acid sequence alignment across distant species. Black boxes mark conserved residues. Red box and arrow indicate temca N to K mutation. (DH) Complementation analysis for temca and scn8abΔ. (D) Swimming behavior of control (scn8ab+/Δ) and scn8ab compound heterozygotes (scn8abtemca/Δ) at 33 °C. (Bottom) Representative 1-min swimming trajectories of individual fish. (E and F) Quantification of 3-min swimming behavior at 33 °C. (E) Average distance traveled (n = 6). (F) Duration of immobility at the bottom of swimming tanks (n = 6). (GI) Regeneration in scn8abtemca normalized to uninjured fin lengths. (G) Representative whole-mount fin images of 7 dpa control and scn8abtemca at 33 °C. (H) Fin lengths at 7 dpa (b in G) normalized to uninjured fin length (a in G). The graph indicates the value of “b/a”. (I) Position of amputation plane. Lengths from base to amputation plane (c in G) were divided by uninjured fin lengths (a in G). The graph indicates the value of “c/a”. The amputation plane was ∼50% of caudal fins in control and scn8abtemca/Δ. n = 8 and 6 for control and scn8abtemca/Δ, respectively. Data are presented as mean ± SD. Student’s unpaired two-tailed t test.

scn8ab Is dispensable during early development. (A) Number of zebrafish with scn8ab+/+, scn8ab+/Δ, and scn8abΔ/Δ genotypes scored at 5 dpf (Left) and at 3 mpf (Right). The observed genotypic ratio matched the expected ratio in 5 dpf larvae from scn8abΔ/+ in-crosses, but no scn8abΔ homozygotes recovered at adult stages (>3 mpf). (B) Representative whole-mount images of control (heterozygous sibling) and temca at 3 mpf. (C and D) Quantification of body weight (C) and body length (D) at 3 mpf (n = 41 and 53 for scn8abtemca/+ and scn8abtemca/Δ, respectively). (E) Control (heterozygotes) and temca 6 dpf larvae swimming tracks at 34 °C. (F) Quantification of swimming behavior of 6 dpf control and temca larvae (n = 16 and 20 for control and temca, respectively). Two-way ANOVA, temperature [F(1,33) = 0.01992, P = 0.889]; genotype [F(1,33) = 0.005127, P = 0.943]; genotype × temperature interaction [F(1,33) = 4.119, P = 0.051]. (G) Representative images of control (heterozygotes) and temca regenerated fin folds 3 dpa at 33 °C. (H) Quantification of 3 dpa larvae fin fold–regenerate lengths at 33 °C (n = 13 and 17 for control and temca, respectively). Scale bars, 1 cm in B, 200 µm in G. (C, D, and H) Data are presented as mean ± SD by Student’s unpaired two-tailed t test.

scn8ab Regulates neuronal activity in the brain. (A) Representative section in situ hybridization of scn8ab transcripts in brain and 2 dpa fins of wild-type fish. Black arrows indicate scn8ab expression. Black arrowhead marks amputation plane. (B) RT-PCR showing scn8ab expression in the zebrafish brain but not in uninjured or regenerating (2 dpa) fins. huC/elavl3 Is used as a brain-specific gene; and4 is a representative gene for regenerating fins; and actb2 is used as a loading control. (C) RNA-seq genome-browser tracks of fin-specific genes (and4 and cldn1), brain-specific genes (elavl3 and elavl4), and scn8ab. Brain and uninjured and 36 h postamputation (hpa) fin profiles of controls were used. (D and E) Confocal, whole-mount, immuno-stained image against pan-Nav antibody of uninjured and 2 dpa wild-type fins. Dashed white lines mark amputation plane. (F) Representative images of brain phosphorylated ERK (p-ERK; red) and HuC/D (green) immunostaining in control (heterozygous siblings) and temca placed at 33 °C for 2 h prior to dissection. White arrows indicate p-ERK+/HuC/D+ double-stained neurons. (G) Quantification of p-ERK+ neurons in 300 × 300 µm2 dorsal telencephalon region (n = 6). Data are presented as mean ± SD. Student’s unpaired two-tailed t test. (H) RNA-seq volcano plot displaying significantly reduced genes in temca placed at 33 °C for 1 d before brain collection. (I) Top Gene Ontology terms for genes up-regulated and down-regulated in temca brains. (DF) Scale bars, 50 µm. ac-Tub, acetylated α-tubulin; Adjust, adjusted.

Early fin regeneration is impaired in temca mutants. (A) Schematic of temperature shift assay. (B) Representative whole-mount images of control (heterozygotes) and temca fin regenerates at 7 dpa shifted to 33 °C right after amputation (0 dpa shift) or at 2 dpa (2 dpa shift). (C) Quantification of fin regenerate lengths at 7 dpa (n = 12, 14, 12, and 11 for 0 dpa shift control and temca and for 2-dpa shift control and temca, respectively). (D) Representative EdU-staining images of control and temca fin regenerates at 2 dpa. (E) Quantification of EdU+ cells in blastema area of 2 dpa fin regenerates (n = 8). (F) Schematic showing amputation and imaging time points of tcfsiam:EGFP transgenic reporter line. (G) Representative whole-mount images of tcfsiam:EGFP control (heterozygotes) and temca fin regenerates at 24, 30, 36, 42, and 48 h postamputation (hpa) at 33 °C. (H) Quantification of tcfsiam:EGFP signal intensity (n = 10 and 9 for control and temca, respectively). Red arrowheads indicate amputation planes. Scale bars, 1 mm in B; 150 µm in D. Data are presented as mean ± SD. Student’s unpaired two-tailed t test.

The temca mutation causes innervation defects in regenerating fins. (A) Schematic of method for assessing axon density and total axon length in 2 dpa fin regenerates. (B) Representative images of acetylated α-tubulin (ac-Tub) staining in 2 dpa control (heterozygotes) and temca fin regenerates at 33 °C. (C and D) Quantification of axon density (C) and total axon length (D) in a 150 × 200 µm2 area of control and temca 2-dpa fin regenerates at 33 °C. (E) Schematic of method for measuring axon bundle thickness and ratio in 2 dpa fin rays. (FH) Representative images of ac-Tub staining (F) and quantification of axon bundle thickness (G) and ratio (H) in control and temca 2 dpa fin regenerates at 33 °C. (I) Schematic depicting angle of nerve bundle regrowth in 2 dpa fin regenerates. (J and K) Representative images of ac-Tub staining (J) and rose plots depicting orientation of regenerated nerve bundles (K) in control and temca 2 dpa fin regenerates at 33 °C (n = 8 and 12 for control and temca, respectively). (L) Representative whole-mount images of control and temca 7 dpa fins at 33 °C. (M) Representative images of ac-Tub staining in control and temca 7 dpa fin regenerates at 33 °C. White arrows indicate misshaped fin rays having misguided nerve bundles. White arrowheads indicate fin rays with complete blockage of regeneration. Insets display an enlarged version of the area in the white boxes. White dotted lines mark the distal tip of epidermis. Scale bars, 50 µm in B and J; 1.5 mm and 500 µm in L Top and Bottom, respectively; 250 µm in M. Data are presented as mean ± SD. Student’s unpaired two-tailed t test.

Acknowledgments
This image is the copyrighted work of the attributed author or publisher, and ZFIN has permission only to display this image to its users. Additional permissions should be obtained from the applicable author or publisher of the image. Full text @ Proc. Natl. Acad. Sci. USA