
- Title
-
The Extracts of Polygonum cuspidatum Root and Rhizome Block the Entry of SARS-CoV-2 Wild-Type and Omicron Pseudotyped Viruses via Inhibition of the S-Protein and 3CL Protease
- Authors
- Lin, S., Wang, X., Tang, R.W., Lee, H.C., Chan, H.H., Choi, S.S.A., Dong, T.T., Leung, K.W., Webb, S.E., Miller, A.L., Tsim, K.W.
- Source
- Full text @ Molecules
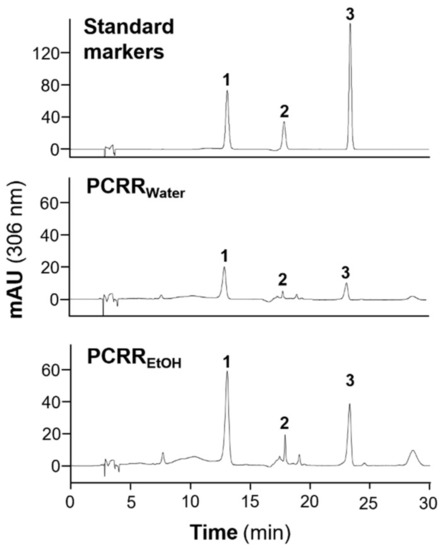
HPLC analysis of the PCRR extracts. The characteristic peaks of three standards, and the peaks obtained for PCRRwater and PCRREtOH, were detected at an absorbance of 306 nm. The three peaks are (1) polydatin, (2) gallic acid, and (3) resveratrol. |

Effect of PCRRwater and PCRREtOH on the inhibition of S-protein-ACE2 binding and 3CL protease activity. (A) Line graph showing the inhibition rate of a standard inhibitor (calibrated to NIBSC code 20/136), which was employed as a positive control. (B,C) PCRRwater and PCRREtOH both inhibited, (B) S-protein-hACE2 binding, and (C) 3CL protease in dose-dependent manners. GC-376 served as a positive control. The inhibition rate was determined from the signal normalized to the control without the extracts. The data represent mean ± SD; n = 3. |

Over expression of ACE2 in HEK293T cells. Cultured HEK293T cells were transfected with cDNA encoding ACE2 for 48 h before being immunolabeled with an anti-ACE2 antibody (in green). The cell nucleus was labelled with DAPI (in blue), while the cytosol and plasma membrane were stained via the expression of ATPase (in red). The cells were visualized, and the images were acquired with a Leica SP8 laser scanning confocal microscope. In each panel, the region indicated by the asterisk is shown in a higher magnification in the inset panel. When the data were quantified, the results showed that >50% of the HEK293T cells had successfully been transfected with ACE2 cDNA. The data represent the mean ± SD; n = 4. The statistical differences were detected utilizing the two-sample t-test, *** p < 0.001. |
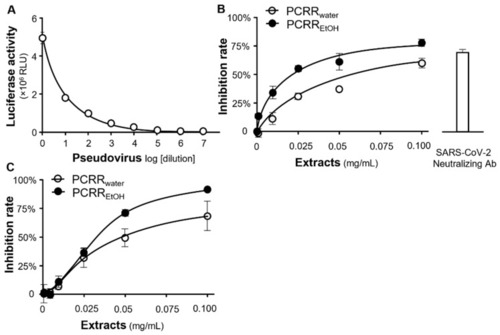
Inhibition of pseudovirus entry. (A) The intracellular luciferase activity (implying the rate of pseudovirus entry in RLU) was detected at different concentrations/dilutions of wild-type pseudovirus. (B) The entry of wild-type pseudovirus was disrupted by PCRRwater and PCRREtOH in dose-dependent manners. (C) These extracts also inhibited the entry of the omicron variant into the host cells. The inhibition rate was calculated based on the luciferase activity, which was normalized to the luciferase activity without any treatment. A SARS-CoV-2 neutralizing antibody at a concentration of 1 µg/mL was employed as a positive control. The data represent mean ± SD; n = 3. |
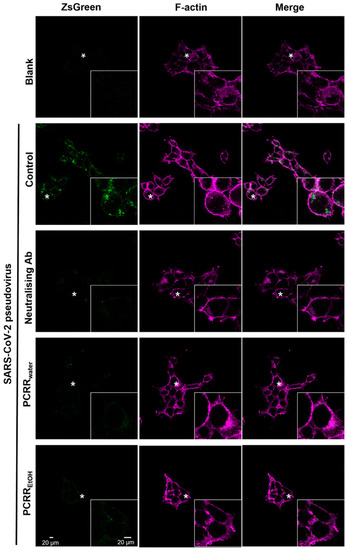
PCRREtOH and PCRRwater inhibit the entry of wild-type pseudovirus. The F-actin component of the cell membrane was stained with fluorescent phalloidin. The intensity of ZsGreen fluorescence in the cells was measured with ImageJ after treatment with PCRREtOH (0.1 mg/mL) or PCRRwater (0.1 mg/mL). The fluorescence intensity was considerably reduced when compared with the control group with no drug treatment. A SARS-CoV-2 neutralizing antibody (1 µg/mL) was utilized as a positive control. These are representative images; n = 3. In each image, the region marked with the asterisk is shown at a higher magnification in the inset panel. |

PCRRwater and PCRREtOH inhibit pseudovirus entry in the zebrafish test. Larvae at 3 dpf were pre-treated with (A) PCRRwater or (B) PCRREtOH before being co-treated with the respective PCRR extracts and the SARS-CoV-2 PEG-pseudovirus for 72 h. PCR amplification of whole larval cDNA indicated the relative level of luc expression in both the treatment and control groups. The relative level of luc expression was determined through normalization to the expression level of g6pd. The data represent the mean ± SD; (n = 4) and statistical differences were detected utilizing the two-sample t-test. |
PCRRwater and PCRREtOH inhibit pseudovirus entry in the zebrafish test. Larvae at 3 dpf were pre-treated with (A) PCRRwater or (B) PCRREtOH before being co-treated with the respective PCRR extracts and the SARS-CoV-2 PEG-pseudovirus for 72 h. PCR amplification of whole larval cDNA indicated the relative level of luc expression in both the treatment and control groups. The relative level of luc expression was determined through normalization to the expression level of g6pd. The data represent the mean ± SD; (n = 4) and statistical differences were detected utilizing the two-sample t-test. |