
- Title
-
Mob4-dependent STRIPAK involves the chaperonin TRiC to coordinate myofibril and microtubule network growth
- Authors
- Berger, J., Berger, S., Currie, P.D.
- Source
- Full text @ PLoS Genet.

The muscle integrity is compromised in gemütlich (geh) mutants.
(A) At 3 dpf, geh mutants appeared unremarkable under bright-field microscopy. (B) In comparison to their siblings, (B’) 3-dpf-old geh homozygotes appeared darker in representative images taken under polarised light conditions. (C) After rescaling to siblings (100 ± 1%), the birefringence of 3-dpf-old geh homozygotes was significantly reduced to 61 ± 1%. Crosses represent averaged birefringence of clutches with a minimum of 6 larvae per genotype (n = 5 clutches). Data are presented as mean ± SEM; *** P < 0.001 calculated by Student’s t-test. (D) Fibrotic signs were not detected on H&E-stained cross sections of 3-dpf-old geh homozygotes and siblings (n = 6 per genotype). Scale bar sizes are indicated. PHENOTYPE:
|
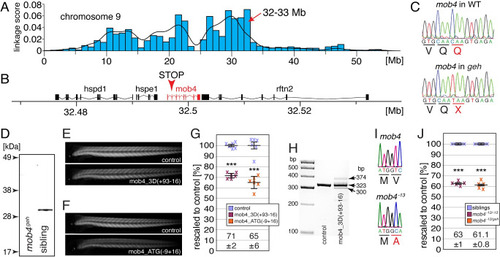
The function of mob4 is lost within gemütlich mutants.
(A) Linkage analysis of gemütlich revealed a region of homozygosity on chromosome 9 with a peak between 32 to 33 Mb. (B) The MOB family member 4 (mob4) gene was located within the linked region. (C) Genomic sequences show that the mutant gemütlich harboured a mob4 allele with a premature stop codon in exon 2 (Q41X). (D) Western blot analysis using antibodies against human MOB4 showed epitope loss in mob4geh homozygotes. (E) Knockdown of mob4 by the morpholinos mob4_3D(+93–16) that targets the splice donor of exon 3 or (F) mob4_ATG(-9+16) that targets the translation start codon led to a reduction in birefringence. (G) Compared to control injected 3-dpf-old larvae (100 ± 1% and 100 ± 2%, respectively), administration of mob4_3D(+93–16) induced a reduction in birefringence to 71 ± 2% and mob4_ATG(-9+16) to 65 ± 6%. Crosses represent individual larvae (n = 6). (H) RT-PCR using primers targeting exons 1 and 5 of mob4 revealed altered splicing in mob4_3D(+93–16)-injected larvae. (I) The mob4-13 allele harboured a genomic deletion of 13 bp from exon 1 (g.5_17del). (J) Compared to 3-dpf-old siblings (both 100 ± 1%), the birefringence of mob4-13 homozygotes and mob4-13/geh compound heterozygotes was significantly reduced to 63 ± 1% and 61.1 ± 0.8%, respectively. Crosses represent averaged birefringence of clutches with a minimum of 6 larvae per genotype (n = 5 clutches). Data are presented as mean ± SEM; *** P < 0.001 calculated by Student’s t-test. EXPRESSION / LABELING:
PHENOTYPE:
|

Mob4 is located at the Z-disk, where it might be involved in the regulation of myofibril assembly.
(A) At 3dpf, antibodies against human MOB4 colocalised with antibodies against the Z-disc protein α-Actinin (n = 6 per genotype). (B) At 3 dpf, the birefringence of mob4geh homozygotes was significantly higher in the transgenic background of Tg(cry:GFP;-503unc:mob4). Also compared to non-transgenic siblings (100 ± 2%), the birefringence of Tg(cry:GFP;-503unc:mob4) transgenic mob4geh homozygotes (108 ± 1%) and siblings (106 ± 1%) was significantly higher. Crosses represent averaged birefringence of clutches with a minimum of 4 larvae per genotype (n = 5 clutches). Data are presented as mean ± SEM; *** P < 0.001 and ** P < 0.01 by one-way ANOVA with post hoc Tukey’s test. (C) In 3-dpf-old siblings and mob4geh homozygotes, Mob4-GFP fusion protein (green) expressed via Tg(cry:GFP;-503unc:mob4-GFP) colocalised to t-tubules (red, arrowhead) marked in the Tg(acta1:mCherryCAAX) transgenic background (n = 3 per genotype). (D) Highlighting F-actin with transgenic Tg(acta1:lifeact-GFP) in green confirmed residual myofibril striation and revealed disorganised thin filaments within mob4geh homozygotes at 3 dpf. Sarcolemma and t- tubules were labelled by mCherry fluorescence (red) in the Tg(acta1:mCherryCAAX) transgenic background (n = 6 per genotype). Boxed areas are magnified. (E) Labelling of F-actin with phalloidin revealed that the robust myofibril striation of siblings was reduced in mob4geh homozygotes at 3 dpf (n = 6 per genotype). (F) At 3 dpf, antibodies against α-Actinin that mark sarcomere’s Z-disks showed the typical striation of the myofibril in siblings and mob4geh homozygotes (n = 4 per genotype). (G) Visualisation of the cephalic muscles in the transgenic Tg(−503unc:GFP) background revealed that, in contrast to siblings, a gap was formed between the two hyohyoideus (hh) muscles in mob4geh homozygotes at 3 dpf (representative Z-stacks) (n = 3 per genotype). (H) At 6 dpf, representative Z-stack projections of Alcian blue stained larvae depicted cartilage malformations in mob4geh homozygotes and a widened angle formed by the two ceratohyal cartilage structures (dotted lines) (n = 4 per genotype). Designations: ceratohyal (ch); Meckel’s cartilage (m); palatoquadrate (pq). Scale bar sizes are indicated. EXPRESSION / LABELING:
PHENOTYPE:
|
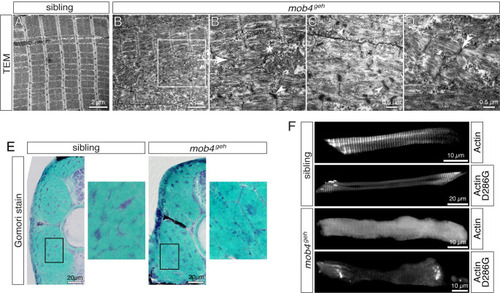
Sarcomere organisation is compromised in mob4geh mutants.
(A) Transmission electron micrograph depicted highly organised and arrayed myofibrils in 3-dpf-old siblings (n = 3). (B) Organised sarcomeres were rarely detected within mob4geh homozygotes (n = 3). (B’) As shown in the magnification of the boxed area, sarcomeres were frequently disorganised and deposits of isolated filaments (asterisk) in addition to electron-dense structures (arrowhead), often associated with Z-disks, were found instead. (C) Electron-dense aggregates of mob4geh homozygotes often showed a lattice structure (arrowhead) and (D) fragmented sarcomeres and widened Z-disks (double-arrowhead) were detected as well. (E) At 3 dpf, Gomori trichrome staining revealed subsarcolemmal dark blue structures within mob4geh homozygotes but not siblings (n = 6 per genotype). Boxed areas are shown in higher magnification. (F) GFP fluorescence of transgenic ACTA1-GFP showed a striated pattern in 3-dpf-old siblings and a uniform pattern in mob4geh homozygotes. Expression of ACTA1D286G-GFP led to rod-shaped structures in siblings and exclusively amorphic aggregates within mob4geh homozygotes (n = 6 per genotype). Scale bar sizes are indicated. |
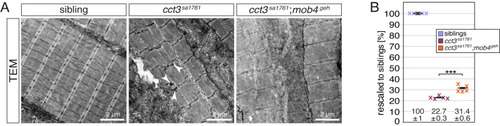
Mob4 interacts with TRiC.
(A) As depicted in transmission electron micrographs, the sarcomere organisation detected in siblings was compromised in single cct3sa1761 homozygotes as well as cct3sa1761;mob4geh compound homozygotes. Electron-dense aggregates (arrowhead) as found in cct3sa1761 homozygotes were absent in cct3sa1761;mob4geh compound homozygotes (n = 3 per genotype). Scale bar sizes are 2 μm. (B) After rescaling to siblings (100 ± 1%), the birefringence of cct3sa1761;mob4geh compound homozygotes (31.4 ± 0.6%) was significantly ameliorated compared to single cct3sa1761 homozygotes (22.7 ± 0.3%). Crosses represent averaged birefringence of clutches with a minimum of 4 larvae per genotype (n = 5 clutches). Data are presented as mean ± SEM; *** P < 0.001 by one-way ANOVA with post hoc Tukey’s test. PHENOTYPE:
|
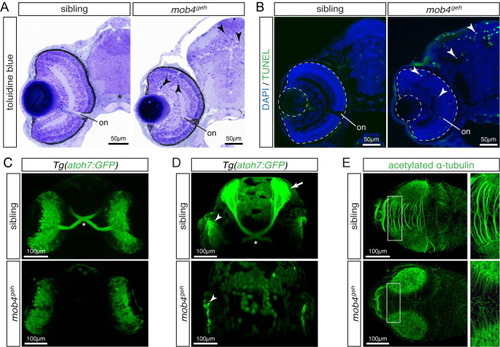
Loss of mob4 function compromises neuronal connectivity.
(A) At 3 dpf, toluidine blue-stained sections displayed pyknotic nuclei (arrowhead) dispersed throughout the retina and tectum of mob4geh homozygotes, not siblings (n = 4 per genotype). (B) Abundant apoptosis within the retina and tectum of 3-dpf-old mob4geh homozygotes was detected by TUNEL assay (n = 8 per genotype). (C) In representative ventral views (Z-stack), the optic chiasm (asterisk) was highlighted by Tg(ath7:GFP) within 3-dpf-old siblings but not mob4geh homozygotes (n = 3 per genotype). (D) In representative Z-stacks, axons of retinal ganglion cell marked by Tg(ath7:GFP) project contralaterally via the optic chiasm (asterisk) from the retina (arrowhead) onto the tectum (arrow) of 3-dpf-old siblings (n = 4). In contrast, axons were not formed by retinal ganglion cells (arrowhead) of mob4geh homozygotes (n = 4). (E) In Z-stacks of 3-dpf-old larvae, antibodies against acetylated α-tubulin revealed defective neurite formation within the tectum of mob4geh homozygotes. Boxed areas are shown in higher magnification (n = 3 per genotype). Scale bar sizes are indicated. EXPRESSION / LABELING:
PHENOTYPE:
|
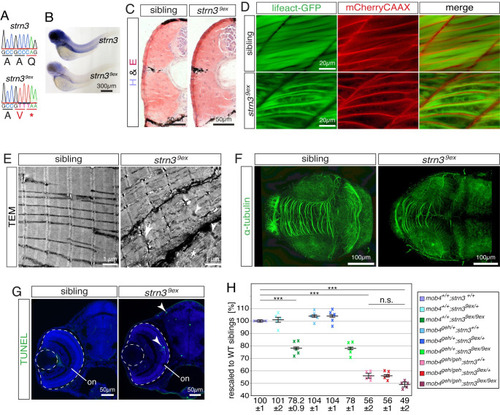
Loss of strn3 phenocopies mob4-deficient zebrafish.
(A) The genomic sequence of the strn39ex allele harboured a deletion of 23,516 bp and simultaneous insertion of 35 bp. (B) In comparison to 3-dpf-old siblings, the signal intensity of the in situ hybridisation using a strn3 probe was strikingly diminished in strn39ex homozygotes (n = 5 per genotype). (C) Fibrotic signs were not detected on representative cross sections of 3-dpf-old strn39ex homozygotes and siblings stained with H&E (n = 6 per genotype). (D) The transgenic marker lines Tg(acta1:lifeact-GFP) and Tg(acta1:mCherryCAAX) revealed that the sarcomere striation of live 3-dpf-old siblings was strikingly reduced in strn39ex homozygotes, which featured disorganised thin filaments instead (n = 7 per genotype). (E) The sarcomere organisation shown in representative transmission electron micrographs of 3-dpf-old siblings was frequently compromised in strn39ex homozygotes. Instead, strn39ex homozygotes featured widened Z-disks (arrow), filament deposits (asterisk) and lattice-patterned electron-dense structures (arrowheads) (n = 3 per genotype). (F) Representative Z-stacks of 3-dpf-old larvae stained with antibodies against acetylated α-tubulin. In contrast to their siblings, the intertectal commissure of strn39ex homozygotes was strikingly reduced with less neurites projecting across tectal lobes (n = 5 per genotype). (G) Enhanced apoptosis within the retina and tectum of 3-dpf-old representative strn39ex homozygotes was confirmed by TUNEL assay (n = 12 per genotype). (H) At 3 dpf, the birefringence of single strn39ex homozygotes (78.2 ± 0.9%) and mob4geh homozygotes (56 ± 2%) as well as strn39ex;mob4geh compound homozygotes (49 ± 2%) was significantly reduced compared to their WT siblings (100 ± 1%). Importantly however, the birefringence of strn39ex;mob4geh compound homozygotes was not significantly reduced compared to their single mob4geh homozygous siblings. Crosses represent averaged birefringence of clutches with a minimum of 4 larvae per genotype (n = 5 clutches). Data are presented as mean ± SEM; *** P < 0.001 calculated by Student’s t-test. Scale bar sizes are indicated. EXPRESSION / LABELING:
PHENOTYPE:
|