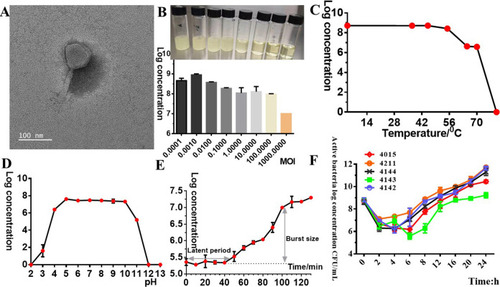
(A) Transmission electron micrograph of phage YC#06 virions negatively stained with 2% phosphotungstic acid. (B to E) Biological properties of phage YC#06. Determination of the optimal MOI (B), temperature tolerance (C), pH sensitivity (D), and one-step growth curve (E). (F) Dynamic curves of bacterial escape from phage control based on viable bacteria counting observation. Phage titers were measured by the double-layer agar method. Data are presented as the mean ± standard deviation (SD).

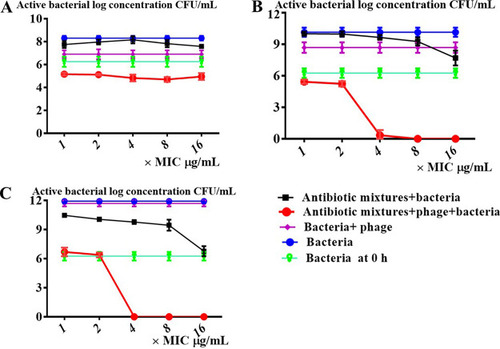
Effect of phage dose on PAS between YC#06 and antibiotic combination. The y axis represents the active bacteria amount, which is calculated by log (CFU/mL). The x axis represents the effective antibiotic concentration. “×MIC” shows that the effective antibiotic concentrations used are at n times the MIC. MICs were chosen according to the Clinical and Laboratory Standards Institute guidelines. Lower, phage dose at a low MOI (0.01); middle, phage dose at a middle MOI (1); high, phage dose at a high MOI (100).

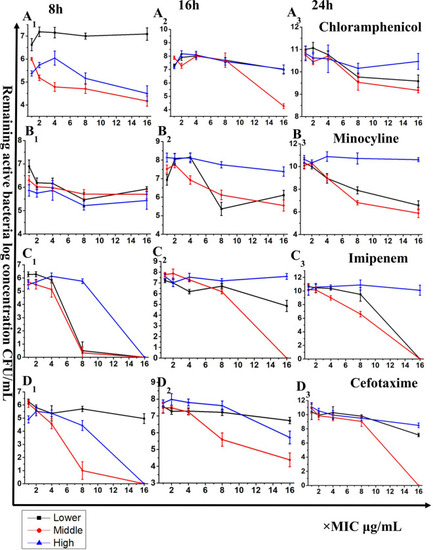
Time-kill analyses of antibiotic mixtures alone and in combination with bacteriophage YC#06 against B.m#4015 at different MICs at the end of 8 h exposure (A), at the end of 16 h exposure (B), and at the end of 24 h exposure (C). Antibiotic mixtures include chloramphenicol, imipenem, and cefotaxime. “×MIC” shows that the effective antibiotic concentrations used are at n times the MIC. MICs were chosen according to the Clinical and Laboratory Standards Institute guidelines. Synergy was defined as a 2-log10 CFU/mL kill compared to the most effective agent (or double-combination regimen) alone at 24 h. Bactericidal activity was defined as a 3-log10 CFU/mL reduction from baseline. Data are presented as the mean ± standard deviation (SD).

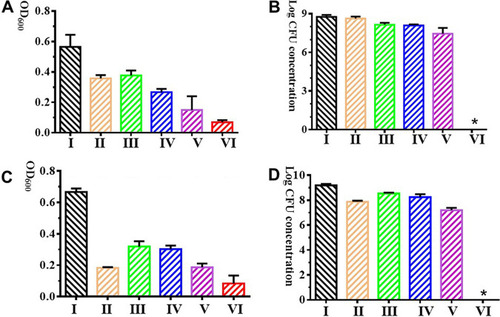
Antibiofilm effect of antibiotic mixtures alone and in combination with bacteriophage YC#06 on biofilm formation inhibition (A, B) and mature biofilm reduction (C, D) in vitro. Antibiotic mixtures include chloramphenicol, imipenem, and cefotaxime. (A and C) Optical density at 600 nm (OD600) was measured using the microplate reader. (B and D) Viable bacteria counting was detected using dilution plate counting method. I, bacteria added alone as control group; II, phage added as treatment group; III and IV, antibiotic mixtures added as treatment group; V and VI, antibiotic mixtures plus phage added as treatment group. For the biofilm formation inhibition experiment in panels A and B, the phage and B.m#4015, antibiotic mixtures and B.m#4015, and antibiotic mixtures plus phage and B.m#4015 were cocultured at the initial time. For the mature biofilm-reducing experiment in panels C and D, phage, antibiotic mixtures, and antibiotic mixtures plus phage were added after mature biofilm was observed. “×MIC” shows that the effective antibiotic concentrations used are at n times the MIC. MICs were chosen according to the Clinical and Laboratory Standards Institute guidelines. Data are presented as the mean ± standard deviation (SD) (*, P < 0.05).

In vivo efficacy of YC#06 and antibiotic mixtures alone or combination against B.m#4015 in a zebrafish model. Monitoring lasted for a period of 7 days. Statistical analyses were performed using a t test for two comparisons and analysis of variance (ANOVA) test (*, P < 0.05).

Acknowledgments
This image is the copyrighted work of the attributed author or publisher, and ZFIN has permission only to display this image to its users. Additional permissions should be obtained from the applicable author or publisher of the image. Full text @ Microbiol Spectr