
- Title
-
Dynamics of the Zebrafish Skeleton in Three Dimensions During Juvenile and Adult Development
- Authors
- Nguyen, S.V., Lanni, D., Xu, Y., Michaelson, J.S., McMenamin, S.K.
- Source
- Full text @ Front. Physiol.
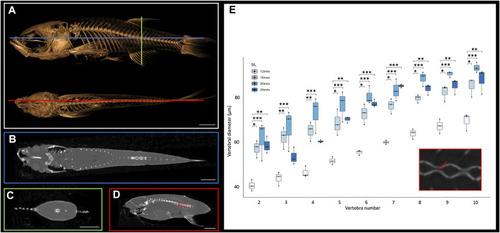
Cross sections of microCT scans visualized in 3D Slicer. (A), Surface rendering of 24 mm SL adult fish with lateral (top) and dorsal (bottom) views with coronal (blue), transverse (green), and sagittal (red) axes indicated. (B), Coronal cross section image. (C), Transverse cross section image. (D), Sagittal cross section image. (E), Quantification of vertebral canal width of 3 individual 24 mm SL adult fish; each individual differentiated with different shapes (circle, square, triangle). Inset shows higher resolution image through vertebrate (corresponding to the boxed detail in panel D). Red arrow indicates a canal from which interior width was measured. Scale bars, 2 mm. |
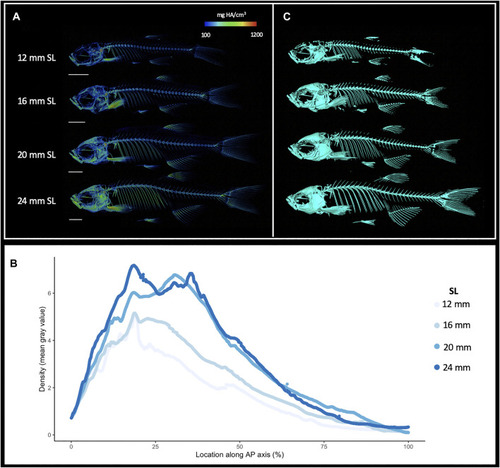
Increasing skeletal density and volume with linear growth. (A), Relative density renderings of skeletons from zebrafish at four different sizes (12, 16, 20, and 24 mm SL). Warmer colors indicate higher density regions. (B), Average density of zebrafish skeleton along the body length of individual zebrafish at four sizes. (C). Volume renderings of zebrafish at four sizes. Scale bars, 2 mm. |
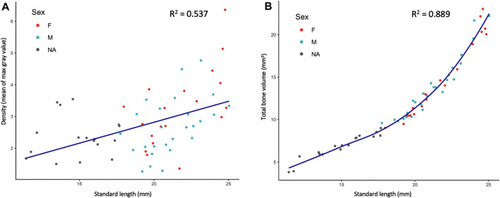
Quantified skeletal density and volume relative to linear growth. (A), Bone density relative to SL. (B), Total bone volume relative to SL. Bone volume calculated from all cross sections of scan. |
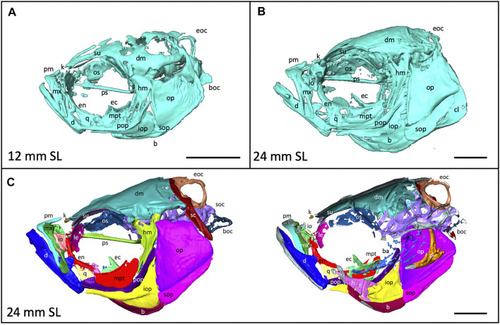
Anatomy of the craniofacial skeleton. (A), Volume rendering of the skull of a 12 mm SL zebrafish and (B), a 24 mm SL zebrafish. (C), Lateral view of skull of 24 mm SL zebrafish with segmented bones (left). Cross section of lateral view reveals some internal elements (right). b, basibrachials; ba, branchial arches; boc, basioccipital; d, dentary; dm, dermatocranium; ec, ectopterygoid; eoc, exocciptal; en, entopterygoid; h, hyoid; hm, hyomandibula; io, infraorbital; iop, interopercle; k, kinethmoid; le, lateral ethmoid; m, maxilla; mpt, metapterygoid; op, opercle; os, orbitosphenoid; pj, pharyngeal jaws; pm, premaxilla; pop, preopercle; ps, parasphenoid, q, quadrate; sc, supracleithrum; soc, supraoccipital; sop, subopercle, su, supraorbital. Scale bars, 1 mm. |
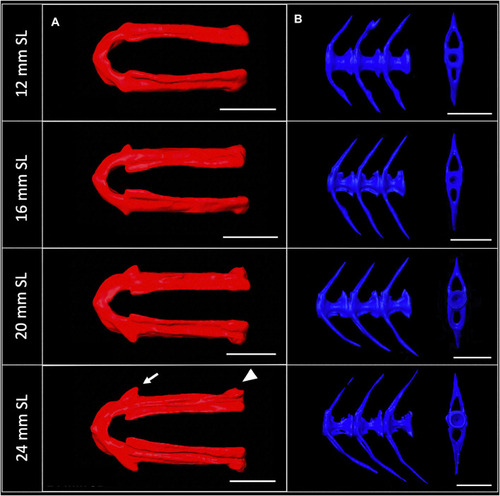
Shape change of the lower jaw and caudal vertebrae. (A), Segmented lower jaws from 12, 16, 20, and 24 mm SL individuals, viewed from the ventral perspective. In the largest individuals, note the pronounced anguloarticular prominence (arrow) and posterior end of lower jaw (arrowhead). (B), Segmented first three caudal vertebrae from 12, 16, 20 and 24 mm SL individuals, viewed from a lateral perspective. Scale bars, 0.5 mm. |