
IMAGE
Fig. 2
- ID
- ZDB-IMAGE-220622-69
- Publication
- Nguyen et al., 2022 - Dynamics of the Zebrafish Skeleton in Three Dimensions During Juvenile and Adult Development
- All Figures
- Figures for Nguyen et al., 2022
Image
|
Figure Caption
Fig. 2
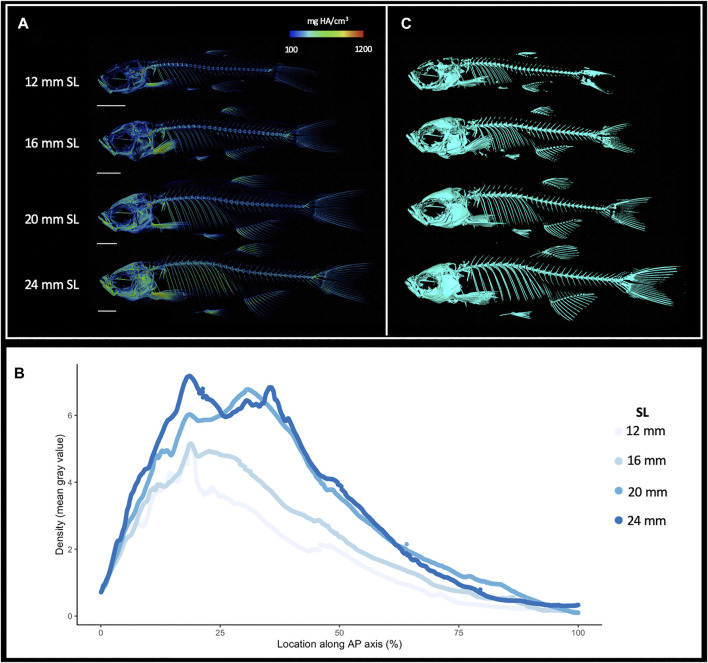
Increasing skeletal density and volume with linear growth. (A), Relative density renderings of skeletons from zebrafish at four different sizes (12, 16, 20, and 24 mm SL). Warmer colors indicate higher density regions. (B), Average density of zebrafish skeleton along the body length of individual zebrafish at four sizes. (C). Volume renderings of zebrafish at four sizes. Scale bars, 2 mm.
Acknowledgments
This image is the copyrighted work of the attributed author or publisher, and
ZFIN has permission only to display this image to its users.
Additional permissions should be obtained from the applicable author or publisher of the image.
Full text @ Front. Physiol.