
- Title
-
Disease modeling by efficient genome editing using a near PAM-less base editor in vivo
- Authors
- Rosello, M., Serafini, M., Mignani, L., Finazzi, D., Giovannangeli, C., Mione, M.C., Concordet, J.P., Del Bene, F.
- Source
- Full text @ Nat. Commun.
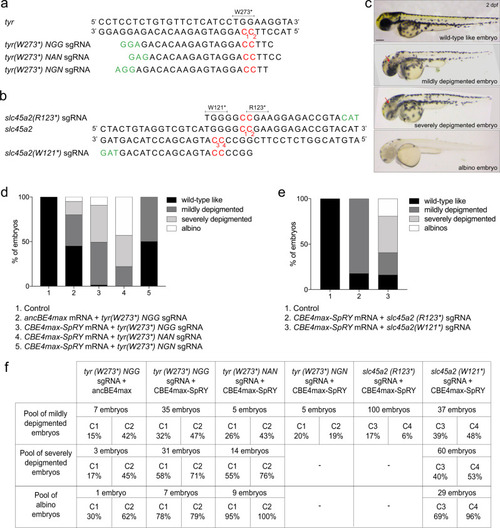
Efficient base conversion generates albino F0 embryos with CBE4max-SpRY and a NAN PAM.
a Targeted genomic sequence of the tyrosinase gene and the 3 different sgRNAs used to introduce the W273* mutation. b Targeted genomic sequence of the slc45a2 gene and the 2 different sgRNAs used to introduce the W121* or R123* mutations. a, b. For each sgRNA, the targeted Cs are in red and the PAM sequence is in green. c Lateral view of representative 2 days post-fertilization (dpf) embryos showing different severity of pigmentation defects (wild-type like, mildly depigmented, severely depigmented, and albino embryos). Scale bar = 100 µm. d Proportion of the 4 groups based on the pigmentation defects described in Fig. 1c for each injection: the AncBE4max mRNA and the tyr(W273*)NGG sgRNA (column 2, 19 embryos in total), the CBE4max-SpRY mRNA and the tyr(W273*)NGG sgRNA (column 3, 74 embryos in total), the CBE4max-SpRY mRNA and the tyr(W273*)NAN sgRNA (column 4, 28 embryos in total), the CBE4max-SpRY mRNA and the tyr(W273*)NGN sgRNA (column 5, 10 embryos in total). e Proportion of the 4 groups based on the pigmentation defects described in c for each injection: the CBE4max-SpRY mRNA with the slc45a2(R123*) sgRNA (column 2, 100 embryos in total) or with the slc45a2(R121*) sgRNA (column 3, 126 embryos in total). f C-to-T conversion efficiency for each targeted Cs and each pool of embryos showing pigmentation defects presented in d, e. The efficiencies have been calculated using EditR tool and chromatograms from Sanger sequencing made on entire PCR products. |
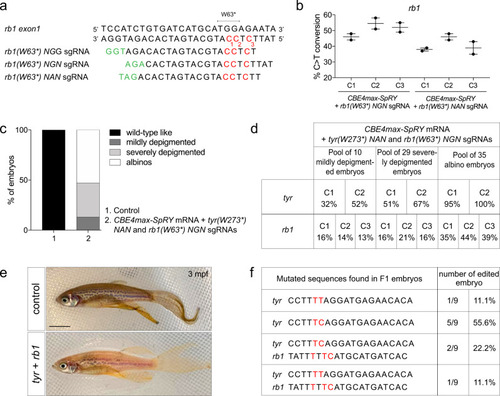
Germline transmission of two mutations generated simultaneously using NAN and NGN PAMs.
a Targeted genomic sequence of the rb1 tumor suppressor gene and the 3 different sgRNAs used to introduce the W63* mutation. For each sgRNA, the targeted Cs are in red and the PAM sequence is in green. b C-to-T conversion efficiency for each targeted Cs in 2 pools of 9 embryos injected with CBE4max-SpRY mRNA and rb1(W63*) NGN or rb1(W63*) NAN sgRNAs. Dot plot showing the means and standard errors of the mean (SEM). c Proportion of the 4 groups based on the pigmentation lack defects described in Fig. for embryos injected with the CBE4max-SpRY mRNA, the tyr(W273*)NAN, and the rb1(W63*)NGN sgRNA (column 2, 74 embryos in total). d C-to-T conversion efficiency for each targeted Cs and each pool of embryos showing pigmentation defects presented in c for the tyrosinase and rb1 genes. The efficiencies have been calculated using EditR tool and chromatograms from Sanger sequencing of PCR products. e Lateral view of a 3 months F0 fish injected at one-cell stage embryo with the CBE4max-SpRY mRNA, the tyr(W273*)NAN, and the rb1(W63*)NGN sgRNAs and showing pigmentation defects. Scale bar = 5 mm. f Sequenced tyr and rb1 loci of 9 F1 single embryos from the founder fish in e. Six embryos out of 9 were single edited for tyrosinase and 3 embryos out of 9 were double edited for tyrosinase and rb1. |
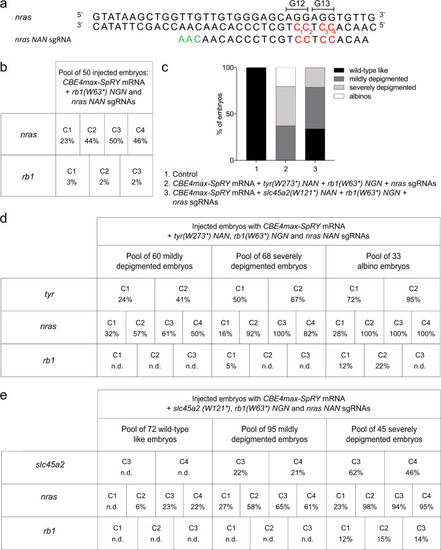
Base editing co-selection method. a a Targeted genomic sequence of the nras oncogene and the sgRNA used to introduce the activating mutation. The targeted Cs are in red and the PAM sequence is in green. b C-to-T conversion efficiency for each targeted Cs in nras and rb1 genes in a pool of 50 embryos injected with CBE4max-SpRY mRNA and nras NAN and rb1 (W63*) NGN sgRNAs. The efficiencies have been calculated using EditR tool42 and chromatograms from Sanger sequencing of PCR products. c Proportion of the 4 groups based on the pigmentation defects described in Fig. 1c for the embryos injected with the CBE4max-SpRY mRNA, the tyr(W273*)NAN, nras NAA and rb1(W63*)NGN sgRNAs (column 2, 161 embryos in total) and with the CBE4max-SpRY mRNA, the slc45a2(W121*), nras NAA and rb1(W63*)NGN sgRNAs (column 3, 212 embryos in total). d, e C-to-T conversion efficiency for each targeted Cs and each pool of embryos showing pigmentation defects presented in Fig. 1b for the tyrosinase, nras, and rb1 genes (d) and the slc45a2, nras, and rb1 genes (e). The albino embryos are the most edited for the three different loci. The efficiencies have been calculated using EditR tool42 and chromatograms from Sanger sequencing of PCR products. N.d. = no base editing detected using EditR tool. |
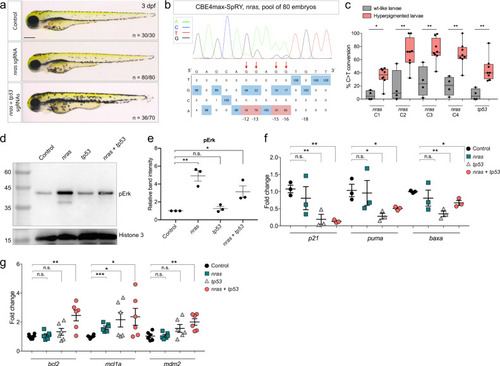
Endogenous activation of nras oncogene and knock-out of tp53 tumor-suppressor gene led to an increase in melanocyte numbers.
a Lateral view of 3 dpf larvae. The injected embryos edited only for nras do not present any defects, whereas 50% of the injected embryos targeted for nras and tp53 were hyperpigmented. Scale bar = 100 µm. b DNA sequencing chromatogram of the targeted nras gene from a pool of 80 injected embryos with the CBE4max-SpRY mRNA and the nras NAN sgRNA. C-to-T conversion shows 83% of efficiency for the C in position 16, 81% for the C in position 15, 78% for the C in position 13, and 16% for the C in position 12 bp away from the PAM. Numbers in the boxes represent the percentage of each base at that sequence position. In red are highlighted the base substitutions introduced by base editing while the original bases are in blue. The color code of the chromatogram is indicated in the upper left corner (Adenine green, Cytosine blue, Thymine red, Guanine black). The distance from the PAM sequence of the targeted C base is indicated below the chromatogram. The efficiencies have been calculated using EditR software and chromatograms from Sanger sequencing of PCR products. c Box plot showing the base editing efficiency for nras and tp53 genes for the 4 “wt-like” larvae and the 8 larvae with increased pigmentation from Supplementary Fig.. Statistical significance was determined using a two-tailed Mann–Whitney test. p value = 0.0162 (nras C1), 0.0081 (nras C2), 0.0081 (nras C3), 0.0040 (nras C4), 0.0020 (tp53). The boxes range from the 25th to 75th percentiles. The box plot whiskers down to the minimum and up to the maximum value, the center shows the median, and each individual value is represented by a point. d Western blot made on 3 dpf control larvae, nras targeted larvae, tp53 targeted larvae or nras and tp53 targeted larvae using CBE4max-SpRY mRNA and antibodies targeting phosphorylated ERK1/2 (pERK) and Histone 3 as loading control. The molecular weight is in kDa. Source data are provided as a Source data file. e Dot plot showing the means and standard errors of the mean (SEM) of the relative band intensity of 3 independent western blots as seen in d. Statistical significance was determined using a two-tailed unpaired t test. p value= 0.0027 (**, control vs nras), 0.3160 (n.s., control vs tp53), 0.0313 (*, control vs tp53 + nras). f, g Dot plots showing the means and SEM of quantitative real-time PCR of p21, puma, baxa (f) and of bcl2, mcl1a, mdm2 (g) expression levels in 3 dpf control larvae, nras targeted larvae, tp53 targeted larvae or nras and tp53 targeted larvae using CBE4max-SpRY mRNA. Statistical significance was determined using a two-tailed unpaired t test. For p21, p value = 0.4881 (n.s., control vs nras), 0.0082 (**, control vs tp53), 0.0011 (**, control vs nras + tp53). For puma, p value = 0.8653 (n.s., control vs nras), 0.0196 (*, control vs tp53), 0.0465 (*, control vs nras + tp53). For baxa, p value = 0.4695 (n.s., control vs nras), 0.0015 (**, control vs tp53), 0.0121 (*, control vs nras + tp53). For bcl2, p value = 0.5810 (n.s., control vs nras), 0.2163 (n.s., control vs tp53), 0.0033 (**, control vs nras + tp53). For mcl1a, p value = 0.0004 (***, control vs nras), 0.0445 (*, control vs tp53), 0.0423 (*, control vs nras + tp53). For mdm2, p value= 0.8956 (n.s., control vs nras), 0.1014 (n.s., control vs tp53), 0.0037 (**, control vs nras + tp53). n = 3 for (f) and n = 6 for (g) independent experiments. |
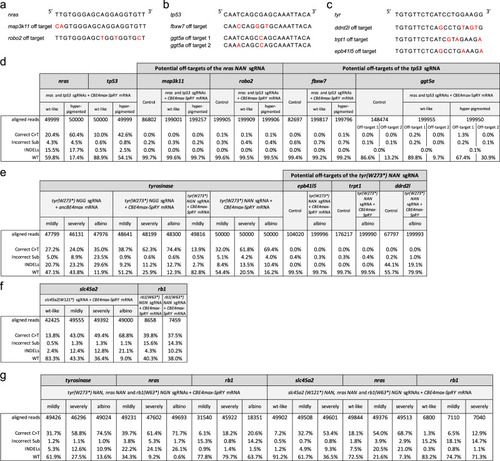
On-target and potential off-target analyses by NGS sequencing. a–c Potential off-target sequences with mismatches in red of the nras NAN sgRNA (a), tp53 sgRNA (b), and tyr(W273*) NAN sgRNA (c). d–g NGS sequencing was made on pools of embryos with at least 6800 analyzed reads for each condition. NGS analyses of on-targets are also shown in Supplementary Fig. |