
|
Fig. 2
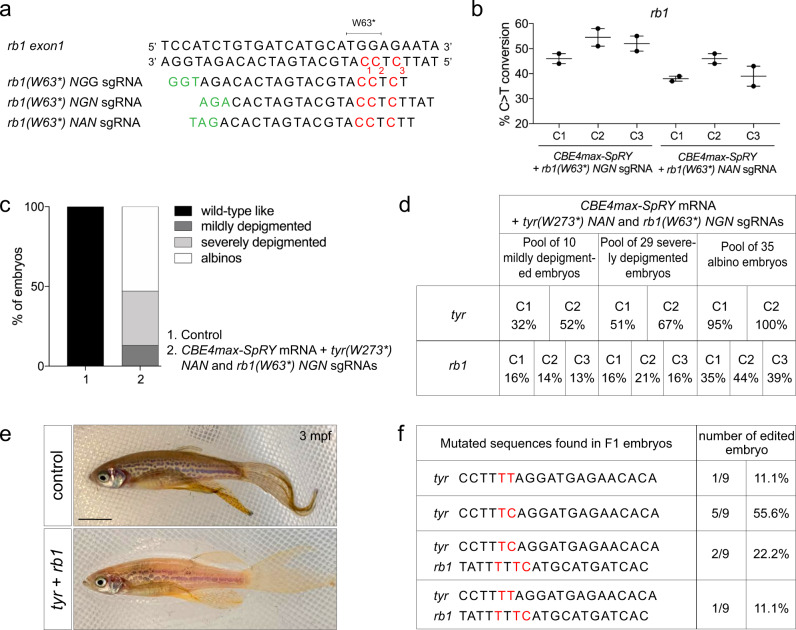
a Targeted genomic sequence of the rb1 tumor suppressor gene and the 3 different sgRNAs used to introduce the W63* mutation. For each sgRNA, the targeted Cs are in red and the PAM sequence is in green. b C-to-T conversion efficiency for each targeted Cs in 2 pools of 9 embryos injected with CBE4max-SpRY mRNA and rb1(W63*) NGN or rb1(W63*) NAN sgRNAs. Dot plot showing the means and standard errors of the mean (SEM). c Proportion of the 4 groups based on the pigmentation lack defects described in Fig. for embryos injected with the CBE4max-SpRY mRNA, the tyr(W273*)NAN, and the rb1(W63*)NGN sgRNA (column 2, 74 embryos in total). d C-to-T conversion efficiency for each targeted Cs and each pool of embryos showing pigmentation defects presented in c for the tyrosinase and rb1 genes. The efficiencies have been calculated using EditR tool and chromatograms from Sanger sequencing of PCR products. e Lateral view of a 3 months F0 fish injected at one-cell stage embryo with the CBE4max-SpRY mRNA, the tyr(W273*)NAN, and the rb1(W63*)NGN sgRNAs and showing pigmentation defects. Scale bar = 5 mm. f Sequenced tyr and rb1 loci of 9 F1 single embryos from the founder fish in e. Six embryos out of 9 were single edited for tyrosinase and 3 embryos out of 9 were double edited for tyrosinase and rb1.