
Fig. 3
- ID
- ZDB-FIG-220617-40
- Publication
- Rosello et al., 2022 - Disease modeling by efficient genome editing using a near PAM-less base editor in vivo
- Other Figures
- All Figure Page
- Back to All Figure Page
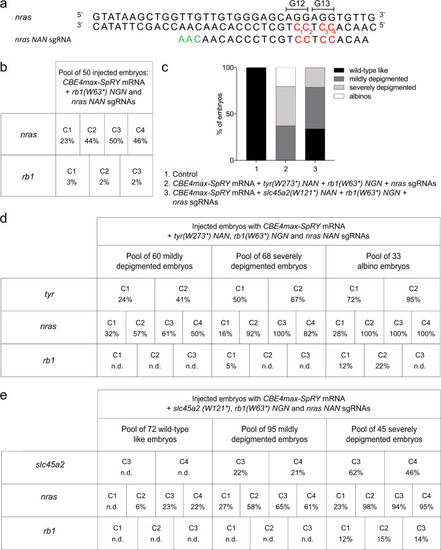
Base editing co-selection method. a a Targeted genomic sequence of the nras oncogene and the sgRNA used to introduce the activating mutation. The targeted Cs are in red and the PAM sequence is in green. b C-to-T conversion efficiency for each targeted Cs in nras and rb1 genes in a pool of 50 embryos injected with CBE4max-SpRY mRNA and nras NAN and rb1 (W63*) NGN sgRNAs. The efficiencies have been calculated using EditR tool42 and chromatograms from Sanger sequencing of PCR products. c Proportion of the 4 groups based on the pigmentation defects described in Fig. 1c for the embryos injected with the CBE4max-SpRY mRNA, the tyr(W273*)NAN, nras NAA and rb1(W63*)NGN sgRNAs (column 2, 161 embryos in total) and with the CBE4max-SpRY mRNA, the slc45a2(W121*), nras NAA and rb1(W63*)NGN sgRNAs (column 3, 212 embryos in total). d, e C-to-T conversion efficiency for each targeted Cs and each pool of embryos showing pigmentation defects presented in Fig. 1b for the tyrosinase, nras, and rb1 genes (d) and the slc45a2, nras, and rb1 genes (e). The albino embryos are the most edited for the three different loci. The efficiencies have been calculated using EditR tool42 and chromatograms from Sanger sequencing of PCR products. N.d. = no base editing detected using EditR tool. |