FIGURE SUMMARY
Title

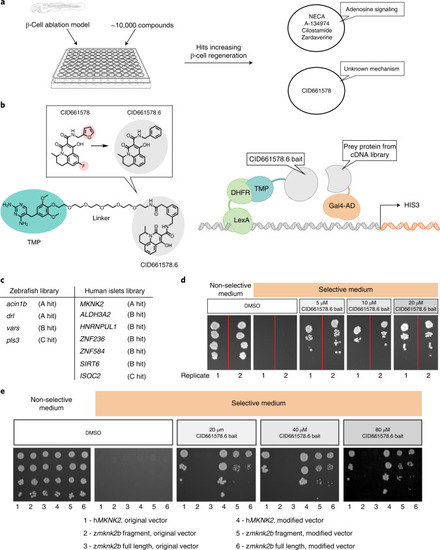
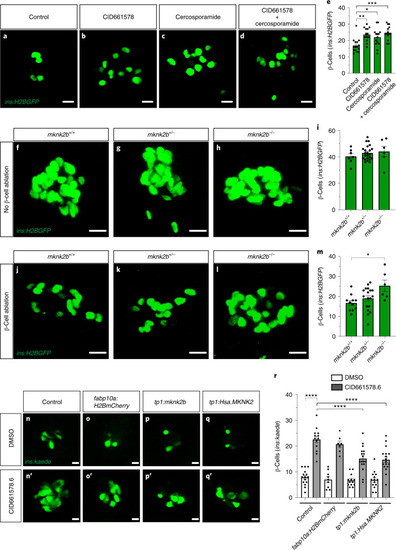
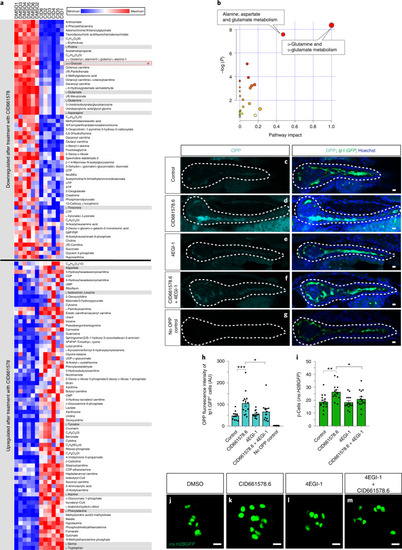
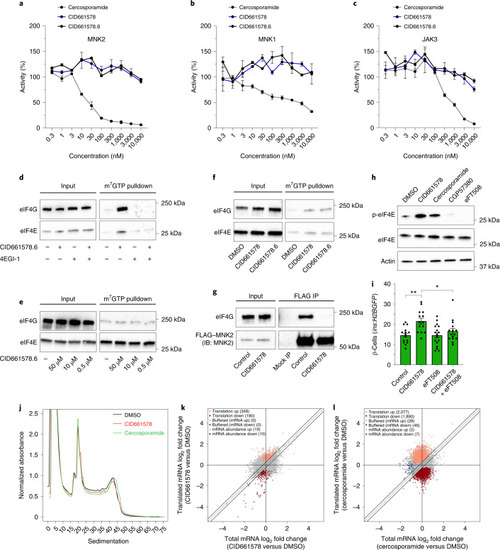
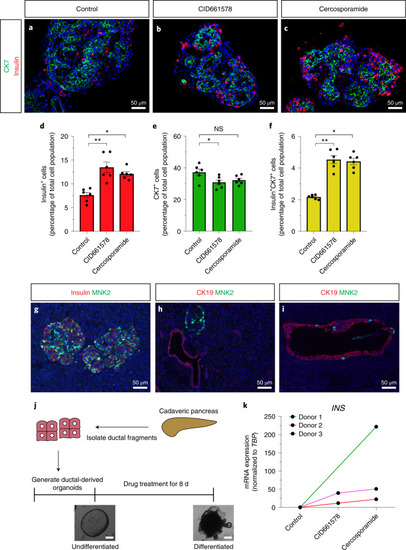
MNK2 deficiency potentiates β-cell regeneration via translational regulation

Authors
Karampelias, C., Watt, K., Mattsson, C.L., Ruiz, Á.F., Rezanejad, H., Mi, J., Liu, X., Chu, L., Locasale, J.W., Korbutt, G.S., Rovira, M., Larsson, O., Andersson, O.
Source
Full text @ Nat. Chem. Biol.

YChemH screen identifies MNK2 as the molecular target of CID661578.

a, Schema for the screening of compounds increasing β-cell regeneration using a transgenic zebrafish model for β-cell ablation and approximately 10,000 compounds. The hits included four compounds affecting adenosine signaling and CID661578 with an unknown mechanism. b, Schematic showing the structures of CID661578 and the analog CID661578.6 along with the screening strategy (YChemH). The red circles highlight the structures that were altered in CID661578. Survival of yeast on selective histidine-free medium was the output of the screen for clones expressing interactors of the CID661578.6 bait; TMP, trimethoprim; AD, activation domain. c, Table summarizing the top hits of the YChemH screen from the two cDNA libraries. The A-classified hits (drl and acin1b from the zebrafish embryo library and MKNK2 from the human islet library) have a higher probability of being true targets of CID661578.6 than B- and C-classified hits. d, Validation of the MNK2–CID661578.6 interaction with different concentrations of CID661578.6 bait and an MNK2-expressing yeast clone. DMSO demonstrates the sensitivity to the selective medium, and yeast clones did not survive in the selective histidine-free medium. The interaction between MNK2 and CID661578.6 promoted yeast survival, as illustrated by the multiple colonies at the four spots of inoculation (decreasing levels of inoculation from the top to the bottom). Each condition was tested in two replicates. e, Validation of the zebrafish Mnk2b–CID661578.6 interaction with different concentrations of CID661578.6 bait and two different DHFR hook vectors. Experiments using the original hook vector, N-LexA–DHFR-C, are listed as 1, 2 and 3. Experiments using the modified vector with the reverse order, N-DHFR–LexA-C, are listed as 4, 5 and 6. Both full-length zebrafish Mnk2b (3 and 6) and a fragment (2 and 4) corresponding to the original fragment of the human MNK2 identified in the screen were used. Human MNK2 was used as a positive control (1 and 4), and zebrafish Mnk2b only mediated binding when expressed by the hook vector with the reverse order (5 and 6) to the one used in the original screen (explaining why zebrafish Mnk2b did not show up as a hit in the original screen).

CID661578.6 increases β-cell regeneration from a pancreatic ductal origin and lowers glucose levels.

a, Schematic of the lineage tracing experiment. Briefly, larvae were treated with 4-hydroxytamoxifen (4-OHT) for 24 h (5-6 d.p.f.) to induce recombination of the reporter. At 28 d.p.f., the fish were treated with MTZ for 24 h to ablate the β-cells, followed by 48 h of treatment with DMSO or CID661578.6. be, Representative images of Tg(ubi:switch); Tg(tp1:creERT2); Tg(ins:flag-NTR) fish treated with DMSO (b) or 2 µM CID661578.6 (c) and immunostained for insulin at 31 d.p.f.; scale bars, 20 µm. Quantifications of the number of β-cells in the secondary islets along the tail of the pancreas (d) as well as the number of β-cells derived from Notch-responsive cells (e) are shown; n = 21 (control) and n = 18 (CID661578.6) for de. An unpaired two-tailed Student’s t-test was used to assess significance for d (*P = 0.0393), and a two-tailed Mann–Whitney test was used for e (**P = 0.0087). Data are presented as mean values ± s.e.m. The experiment shown in b and c was repeated twice with similar results. f, Blood glucose was measured 3 d post-β-cell ablation (d.p.a.) in 4-month-old fish treated with DMSO or CID661578.6. Blood glucose levels in zebrafish without β-cell ablation were included as a basal-state reference; n = 7 (control), n = 10 (control, 3 d.p.a.), n = 10 (CID661578.6, 3 d.p.a.). A one-way ANOVA followed by Šidák’s multiple comparisons test was used to assess significance for f (**P = 0.0078). Data are presented as mean values ± s.e.m. g,h, UMAP plots showing the different cell types present in the adult zebrafish pancreas after reanalysis of published single-cell RNA-seq data (g) and expression of mknk2b (h) at various levels in the different clusters.

Source data

CID661578 targets Mnk2b in vivo to promote β-cell regeneration.

ae, Representative images of Tg(ins:H2BGFP); Tg(ins:flag-NTR) larvae treated with MTZ from 3 to 4 d.p.f. to ablate β-cells, followed by treatment with DMSO (a), 10 µM CID661578 (b), 500 nM cercosporamide (c) or a combination of drugs thereof (d) for 2 d; scale bars, 10 µm. Quantification of the regenerated β-cells is shown in e; n = 15 (control), n = 14 (CID661578), n = 14 (cercosporamide) and n = 14 (CID661578 + cercosporamide). A Kruskal–Wallis test followed by Dunn’s multiple comparisons test was used to assess significance for e (**P = 0.0027, *P = 0.0280 and *** P = 0.0003). Data are presented as mean values ± s.e.m. fi, Representative maximum projections of mknk2b+/+ (f), mknk2+/– (g) and mknk2b−/− (h) Tg(ins:H2BGFP); Tg(ins:flag-NTR) 6 d.p.f. larvae. Quantification of the β-cell number in the basal state for all genotypes is shown in i; scale bars, 10 µm; n = 7 (mknk2+/+), n = 23 (mknk2b+/–) and n = 6 (mknk2b–/–). Data are presented as mean values ± s.e.m. jm, Representative maximum projections of mknk2b+/+ (j), mknk2b+/– (k) and mknk2b–/– (l) Tg(ins:H2BGFP); Tg(ins:flag-NTR) 6 d.p.f. larvae following 2 d of β-cell regeneration. Quantification of the β-cell number for all genotypes is shown in m; scale bars, 10 µm; n = 11 (mknk2b+/+), n = 18 (mknk2b+/–) and n = 6 (mknk2b–/–). A Kruskal–Wallis test followed by Dunn’s multiple comparisons test was used to assess significance for m (*P = 0.0198). Data are presented as mean values ± s.e.m. nr, Single-plane confocal images of Tg(ins:H2BGFP); Tg(ins:flag-NTR) larvae treated with DMSO (nq) or CID661578.6 (n′q′) that were uninjected (n and n′) or injected at the one-cell stage with control fabp10a:H2BmCherry (o and o′), tp1:mknk2b (p and p′) or tp1:Hsa.MKNK2 (q and q′) vectors together with transposase mRNA to induce mosaic overexpression of the zebrafish Mnk2b or the human MNK2 in Notch-responsive cells. Quantification results revealed that overexpression of either mknk2b or MKNK2 significantly blocked the effect of CID661578.6 on β-cell regeneration (r); scale bars, 10 µm; n = 15 (control + DMSO), n = 13 (control + CID661578.6), n = 9 (fabp10a:H2BmCherry + DMSO), n = 7 (fabp10a:H2BmCherry + CID661578.6), n = 13 (tp1:mknk2b + DMSO), n = 17 (tp1:mknk2b + CID661578.6), n = 14 (tp1:Hsa.MKNK2 + DMSO) and n = 17 (tp1:Hsa.MKNK2 + CID661578.6). A one-way ANOVA followed by Tukey’s multiple comparisons test was used to assess significance for r (****P < 0.0001 for control + DMSO versus control + CID661578.6, control + CID661578.6 versus tp1:mknk2b + CID661578.6 and control + CID661578.6 versus tp1:Hsa.MKNK2 + CID661578.6). Data are presented as mean values ± s.e.m.

Source data

CID661578 boosts protein synthesis to increase β-cell regeneration.

a, Heat map showing significantly downregulated and upregulated metabolites following treatment with CID661578 (t-test analyses). Pools of 10 wild-type larvae at 5 d.p.f. were used for each of the six independent biological replicates for DMSO (DMSO1–DMSO6) or CID661578 (CID1–CID6) treatment from 4 to 5 d.p.f. Gray shading highlights the amino acids regulated in the samples, and the red asterisk highlights the glucose metabolite. b, Pathway analysis assessing 81 characterized metabolic pathways in zebrafish using the significantly downregulated metabolites. Boxes show the most significantly affected pathways (false discovery rate < 0.05) following treatment with CID661578. ch, Single-plane confocal images of Tg(tp1:GFP); Tg(ins:flag-NTR) pancreata from 5 d.p.f. larvae incubated with OPP for 18 h to label protein synthesis during treatment with DMSO (c), CID661578.6 (d), 4EGI-1 (e) or CID661578.6 together with 4EGI-1 (f). Larvae that were not incubated with OPP but were developed to visualize the fluorophore (g) were used as controls to assess background staining. White dashed lines outline the pancreata of the larvae. Quantification of the OPP fluorescence intensity levels in the Notch-responsive cells is shown in h; scale bars, 10 µm; n = 12 (control), n = 13 (CID661578.6), n = 11 (4EGI-1), n = 13 (CID661578.6 + 4EGI-1) and n = 8 (no OPP control); AU, arbitrary units. A one-way ANOVA followed by Šidák’s multiple comparisons test was used to assess significance for h (***P = 0.0004 and *P = 0.0151). Data are presented as mean values ± s.e.m. im, Representative images of Tg(ins:H2BGFP); Tg(ins:flag-NTR) larvae treated with DMSO (j), CID661578.6 (k), 4EGI-1 (l) or CID661578.6 together with 4EGI-1 (m) for 2 d following β-cell ablation. Quantification of the number of β-cells (i) showed that 4EGI-1 treatment could abolish the effect of CID661578.6 on β-cell regeneration; scale bars, 10 µm; n = 15 (control), n = 14 (CID661578.6), n = 14 (4EGI-1) and n = 14 (CID661578.6 + 4EGI-1). A one-way ANOVA followed by Šidák’s multiple comparisons test was used to assess significance for i (**P = 0.0022 and *P = 0.0341). Data are presented as mean values ± s.e.m.

Source data

CID661578 increases the interaction between eIF4G and eIF4E and leads to translational changes, without affecting the kinase activity of MNK2.

ac, Dose–response of CID661578, CID661578.6 or cercosporamide on MNK2 (a), MNK1 (b) and JAK3 (c) kinase activity in vitro; n = 2 for each concentration tested. Data are presented as mean values ± s.e.m. d, Immunoblotting against eIF4G and eIF4E after an m7GTP pulldown assay in lysates of COLO 320HSR cells after 6-h treatment with DMSO, CID661578.6, 4EGI-1 or CID661578.6 together with 4EGI-1. For a loading control, 5% of the input was used. e, Immunoblotting against eIF4G and eIF4E after an m7GTP pulldown assay in rabbit reticulocytes treated with the indicated concentrations of CID661578.6. f, Immunoblotting against eIF4G and eIF4E after an m7GTP pulldown assay in lysates of PANC-1 cells treated with DMSO, CID661578 or CID661578.6 for 6 h. For a loading control, 1% of the input was used. g, Immunoblotting against eIF4G and FLAG–MNK2 after an immunoprecipitation (IP) assay with anti-FLAG in lysates of PANC-1 cells that were treated for 6 h with DMSO or CID661578. For a loading control, 1% of the input was used; IB, immunoblot. h, Immunoblotting against phospho-eIF4E (Ser 209; p-eIF4E), total eIF4E and actin in lysates of PANC-1 cells after 6-h treatment with DMSO, CID661578, cercosporamide, CGP57380 or eFT508. i, Quantification of the number of β-cells in 6 d.p.f. zebrafish larvae following β-cell ablation and treatment for 48 h with DMSO, CID661578, eFT508 or a combination of CID661578 and eFT508; n = 15 (control), n = 14 (CID661578), n = 17 (eFT508) and n = 15 (CID661578.6 + eFT508). A one-way ANOVA followed by Dunnett’s multiple comparisons test was used to assess significance for i (**P = 0.0014 (control versus CID661578) and *P = 0.0283 (CID661578 versus CID661579 + eFT508)). Data are presented as mean values ± s.e.m. Experiments in dh were repeated at least two times. j, Representative polysome tracings from optimized sucrose gradients of PANC-1 cells treated with DMSO, CID661578 or cercosporamide. k,l, Scatter plots showing log2 fold changes for total mRNA (x axis) and polysome-associated mRNA (y axis) for the comparisons of CID661578 (k) and cercosporamide (l) to DMSO. Color codes indicate significantly affected mRNAs identified by anota2seq analysis.

Source data

CID661578/cercosporamide treatment increases β-cell differentiation in ductal cells from neonatal pigs and human organoids.

af, Images of neonatal pig islets treated with DMSO (a), CID661578 (b) or cercosporamide (c) and stained for insulin (red) and the ductal cell marker CK7 (green). Quantification results showed that treatment with either CID661578 or cercosporamide increased the number of insulin+ β-cells (d), decreased the number of CK7+ duct cells (e) and increased the number of double-positive (insulin+CK7+) cells (f); n = 6; **P = 0.0041 and *P = 0.0116 (d); *P = 0.0401 and P = 0.1671 (NS, not significant) (e); **P = 0.0034 and *P = 0.0137 (f). A Kruskal–Wallis test followed by Dunn’s multiple comparisons test was used to assess significance for df. Data are presented as mean values ± s.e.m. gi, Images of human pancreatic sections from different donors stained for MNK2, with insulin used as a marker of β-cells and CK19 used to mark the pancreatic duct. Similar results have been reproduced in stainings from pancreatic sections of multiple human donors. j,k, Schema showing the procedure for generating and treating human ductal-derived organoids (j). Brightfield images of representative examples of human ductal-derived organoids before differentiation and after treatment with cercosporamide are shown; scale bar, 200 µm. INS mRNA expression is shown in k for three different organoid preparations (that is, from three different donors) for cercosporamide and two for CID661578. The experiment was reproducible in at least two different organoid preparations.

Source data

Acknowledgments
This image is the copyrighted work of the attributed author or publisher, and ZFIN has permission only to display this image to its users. Additional permissions should be obtained from the applicable author or publisher of the image. Full text @ Nat. Chem. Biol.