|
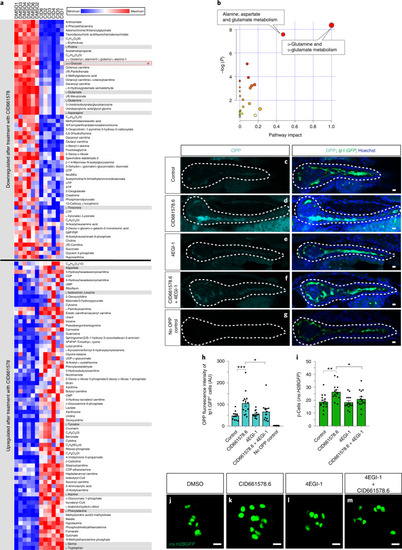
CID661578 boosts protein synthesis to increase β-cell regeneration.a, Heat map showing significantly downregulated and upregulated metabolites following treatment with CID661578 (t-test analyses). Pools of 10 wild-type larvae at 5 d.p.f. were used for each of the six independent biological replicates for DMSO (DMSO1–DMSO6) or CID661578 (CID1–CID6) treatment from 4 to 5 d.p.f. Gray shading highlights the amino acids regulated in the samples, and the red asterisk highlights the glucose metabolite. b, Pathway analysis assessing 81 characterized metabolic pathways in zebrafish using the significantly downregulated metabolites. Boxes show the most significantly affected pathways (false discovery rate < 0.05) following treatment with CID661578. c–h, Single-plane confocal images of Tg(tp1:GFP); Tg(ins:flag-NTR) pancreata from 5 d.p.f. larvae incubated with OPP for 18 h to label protein synthesis during treatment with DMSO (c), CID661578.6 (d), 4EGI-1 (e) or CID661578.6 together with 4EGI-1 (f). Larvae that were not incubated with OPP but were developed to visualize the fluorophore (g) were used as controls to assess background staining. White dashed lines outline the pancreata of the larvae. Quantification of the OPP fluorescence intensity levels in the Notch-responsive cells is shown in h; scale bars, 10 µm; n = 12 (control), n = 13 (CID661578.6), n = 11 (4EGI-1), n = 13 (CID661578.6 + 4EGI-1) and n = 8 (no OPP control); AU, arbitrary units. A one-way ANOVA followed by Šidák’s multiple comparisons test was used to assess significance for h (***P = 0.0004 and *P = 0.0151). Data are presented as mean values ± s.e.m. i–m, Representative images of Tg(ins:H2BGFP); Tg(ins:flag-NTR) larvae treated with DMSO (j), CID661578.6 (k), 4EGI-1 (l) or CID661578.6 together with 4EGI-1 (m) for 2 d following β-cell ablation. Quantification of the number of β-cells (i) showed that 4EGI-1 treatment could abolish the effect of CID661578.6 on β-cell regeneration; scale bars, 10 µm; n = 15 (control), n = 14 (CID661578.6), n = 14 (4EGI-1) and n = 14 (CID661578.6 + 4EGI-1). A one-way ANOVA followed by Šidák’s multiple comparisons test was used to assess significance for i (**P = 0.0022 and *P = 0.0341). Data are presented as mean values ± s.e.m. Source data
|