
- Title
-
Short chain fatty acids (SCFAs) improves TNBS-induced colitis in zebrafish
- Authors
- Morales Fénero, C., Amaral, M.A., Xavier, I.K., Padovani, B.N., Paredes, L.C., Takiishi, T., Lopes-Ferreira, M., Lima, C., Colombo, A., Saraiva Câmara, N.O.
- Source
- Full text @ Curr Res Immunol
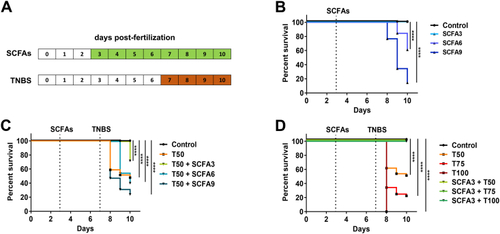
SCFAs increase survival in TNBS-exposed larvae. A. Experimental design of SCFAs and TNBS treatment. Larvae were treated with SCFAs from 3 to 10 dpf with a change of medium at day 7. TNBS was added to the medium at 7 dpf and kept until 10 dpf. B. Percent survival of larvae exposed to SCFAs at 3 mM (SCFA3), 6 mM (SCFA6) and 9 mM (SCFA9), from 3 to 10 dpf. Log-rank (Mantel-Cox), ****p < 0.0001 compared to control. N = 90–130. C. Percent survival of larvae exposed to TNBS 50 μg/mL (T50) from 7 to 10 dpf and treated with SCFA 3, 6 and 9 mM from 3 to 10 dpf. Log-rank (Mantel-Cox), ****p < 0.0001 compared to control. N = 100–136. D. Percent survival of larvae exposed to TNBS 50 μg/mL (T50), 75 μg/mL (T75) and 100 μg/mL (T100) from 7 to 10 dpf and treated with SCFA 3 mM from 3 to 10 dpf. Log-rank (Mantel-Cox), ****p < 0.0001 compared to control. N = 70–80. PHENOTYPE:
|
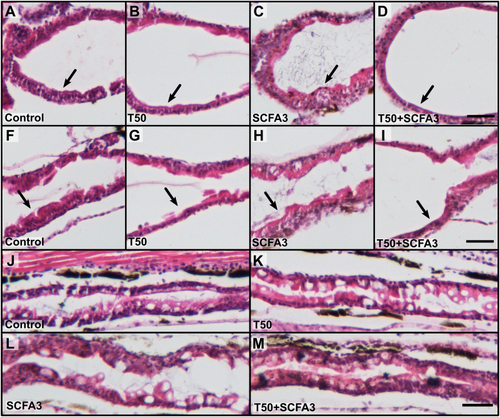
SCFAs do not restore TNBS-induced erosion damage. Representative histology images stained with Hematoxylin and Eosin from the intestine of the zebrafish, focusing on the bulb (A–D), anterior and mid-intestine junction (F–I), and posterior intestine (J–M) from larvae of 10 dpf. Rostral to the left and dorsal up. Black arrow showing thickness of the intestinal wall. Scale bar 500 μm. N = 10. PHENOTYPE:
|

SCFAs restore endocytic function but not mucus production. A. Representative images of the mid-intestine of larvae at 10 dpf exposed to Neutral Red vital staining. Rostral to the left and dorsal up. Scale bar 100 μm. B. Graph representing the area of neutral red staining in the mid-intestine of 10 dpf larvae. One-way ANOVA with multiple comparisons. ****p < 0.0001. N = 19–32. C. Representative images of the mid-intestine of larvae at 10 dpf stained with Alcian Blue. Rostral to the left and dorsal up. Scale bar 100 μm. D. Graph representing the number of goblet cells stained by Alcian Blue at the mid-intestine of 10 dpf larvae. One-way ANOVA with Tukey's multiple comparisons. **p < 0.01; ****p < 0.0001. N = 42–45. (For interpretation of the references to colour in this figure legend, the reader is referred to the Web version of this article.) PHENOTYPE:
|
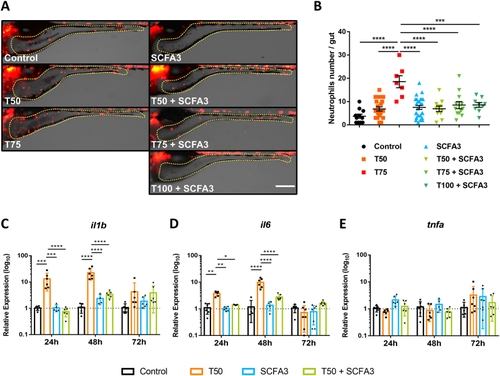
SCFAs decrease TNBS-induced inflammation. A. Representative images of the intestinal area (yellow dotted line) of Tg(lysC:DsRed2)nz50 transgenic larvae after 72h (10 dpf) of 50 μg/mL (T50) and 75 μg/mL (T75) TNBS exposure and treated with 3 mM of SCFAs (SCFA3). Rostral to the left and dorsal up. Scale bar 200 μm. B. Graphical representation of the number of lysC: DsRed + cells (neutrophils) in the intestine of 10 dpf larvae. One-way ANOVA with Tukey's multiple comparisons. ****p < 0.0001. N = 7–26. C-E. Relative expression of il1b(C), il6(D), and tnfa(E), in whole larvae after 24, 48 and 72h of TNBS 50 μg/mL exposure and treated with SCFA 3 mM. Two-way ANOVA with Tukey's multiple comparisons. *p < 0.05; **p < 0.01; ***p < 0.001; ***p < 0.0001. N = 4–7. (For interpretation of the references to colour in this figure legend, the reader is referred to the Web version of this article.) |
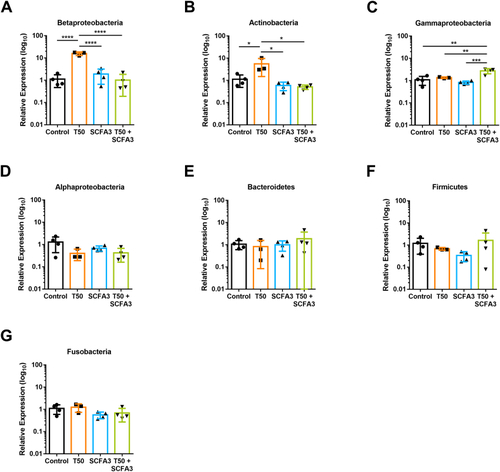
Microbiota changes induced by TNBS and SCFAs-exposed animals. Relative expression of 16S rRNA phylum-specific genes representatives of Betaproteobacteria (A), Actinobacteria (B), Gammaproteobacteria (C), Alphaproteobacteria (D), Bacteroidetes (E), Firmicutes (F), and Fusobacteria (G), from 10 dpf larvae. One-way ANOVA with Tukey's multiple comparisons, *p < 0.05, **p < 0.01, ***p < 0.001, ****p < 0.0001. N = 3–4. PHENOTYPE:
|