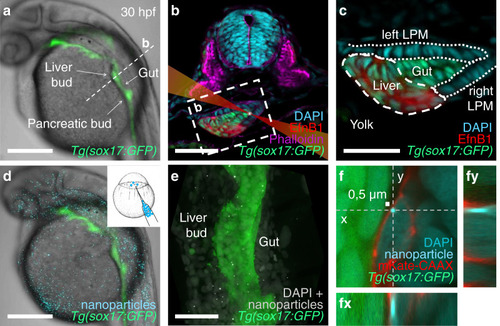
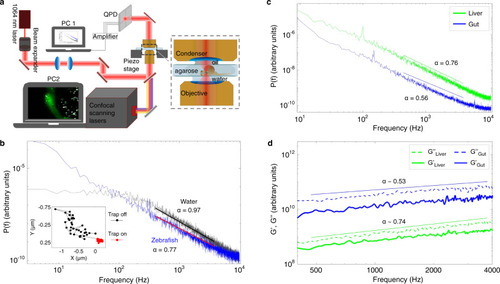
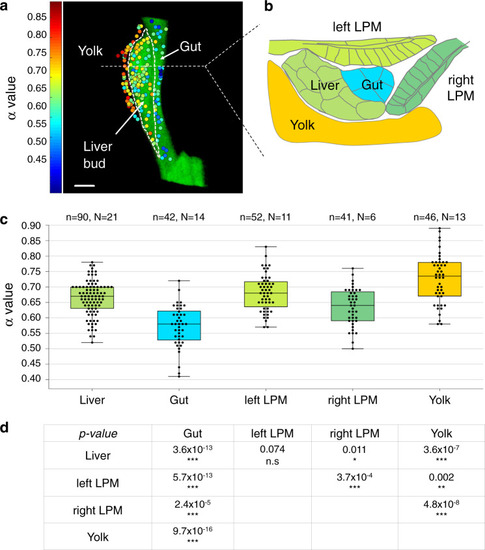
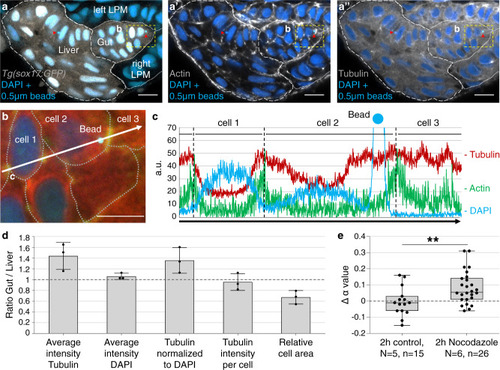
Injected nanoparticles distribute throughout the embryo, including the foregut region in 28–30 hpf zebrafish embryos.

a Transgenic tg(-0.5 sox17:GFP)zf99 visualizes the endoderm in a living zebrafish embryo, including the foregut organ primordia. b Transverse section through the foregut region (dashed line in a) with schematized laser beam path (red) and bead (white). The foregut endoderm expresses transgenic sox17:GFP (green) and liver progenitors EphrinB1 (red); DAPI marks nuclei (cyan); and Phalloidin marks F-actin (magenta). c Magnification of the foregut region shown in (b) (white dashed rectangle). d 0.5 µm polystyrene particles (cyan) microinjected at the one-cell stage distribute throughout the embryo, including the endoderm (green), without causing apparent morphological defects. e Maximum intensity projection of confocal z-stack showing nanoparticle distribution (white) in the foregut region, GFP marks the endoderm. f Confocal image of a representative nanoparticle (light blue) located in the cytoplasm between the nucleus (darker blue) and plasma membrane (red) in a fixed embryo. (fy) and (fx) show orthogonal views in the “yz” plane (dashed line “y” in (f)) and “xz” plane (dashed line “x” in (f)), respectively. Scale bars a, d: 250 µm; b, e: 50 µm; c: 30 µm; f: 0,5 µm (scale bar next to bead).

Forward-scattered light from optically trapped nanoparticles in living zebrafish can be used to infer cellular viscoelasticity.

a Schematic of the setup for laser tracking of nanoparticles in vivo: the laser beam (1064 nm, red line) is focused in the embryo (inset) and the forward-scattered light is collected by a condenser and imaged onto a quadrant photodiode (QPD). In all optical trapping experiments, the immobilized zebrafish were mounted dorsolaterally in agarose on a microscope slide with the liver bud facing the objective. b Examples of positional power spectra of optically trapped particles in water (black, α = 0.97) or in a zebrafish embryo (blue, α = 0.77). The straight lines show fits of Eq. (1) to data. The inset shows the trajectories of a trapped (red) and a freely diffusing (black) particle in the foregut region of a living zebrafish embryo. c Power spectra of optically trapped nanoparticles in liver (green) or gut progenitors (blue). Full lines show linear fits to the double logarithmic plot in the frequency interval 400 Hz < f < 4000 Hz, yielding scaling exponents of 0.56 ± 0.08 (gut) and 0.76 ± 0.06 (liver), respectively. d Symbols (blue and green) provide the storage moduli, G’, of the gut and liver, same colors as in (c) and (d). The corresponding loss moduli, G”, are shown with dashed lines for comparison of the amplitude. G” dominates G’ over the 400–4000 Hz frequency interval for both tissue types. The full lines show fits to the loss moduli data in the corresponding region to the power spectra (c), returning scaling exponents of 0.53 ± 04 (gut) and 0.74 ± 0.05 (liver). The data shown in (c, d) is an average of five experiments for each cell type.

Viscoelastic mapping of the foregut region reveals different biomechanical properties of neighboring progenitor populations.

a 2D projection of viscoelasticity map of the liver, gut, and yolk. The color scale on the left indicates cellular viscoelasticity: increasing blue values show more elastic tissues, while increasing red values represent more viscous tissues (n = 178 nanoparticles, N = 32 embryos). Scale bar: 20 µm. b Viscoelasticity map of the foregut region in a projection orthogonal to (a) and using color code corresponding to average α values for each tissue type, color scale bar as in (a). c Quantification of α values for different tissues shown in a box plot; n = number of analyzed particles, N = number of embryos. d Statistical comparison of α value distributions between different tissues. The table provides the P value calculated for each pair of tissues using a two-tailed equal variance Student’s t test. *P < 0.05, **P < 0.01, ***P < 0.001.

Microtubules surround injected nanoparticles and their concentration is increased in gut progenitors.

aa” Transverse section of a 30 hpf tg(sox17:GFP) embryo microinjected with 0.5 µm fluorescent polystyrene beads (light blue dots next to red arrowheads) showing Phalloidin staining of actin filaments (gray in (a’)) and β-tubulin staining to visualize microtubules (gray in (a”)). Fluorescent emission of microinjected beads and nuclear DAPI occurs at similar wavelengths; beads are detected by size and high signal intensity. Scale bar: 10 µm. b Magnification of cellular bead location (yellow dashed rectangle in (aa”)). Cell borders are outlined based on the presence of cortical actin (dashed lines). Scale bar: 20 µm. c Intensity profile of actin, tubulin, and DAPI along the white arrow in (b). The high peak in the DAPI channel indicates bead position. d Ratio of tubulin levels between gut and liver determined from tissue volumes with a typical linear dimension of 20 µm (see “Methods” and Supplementary Fig. 5). The average intensity represents the signal intensity normalized to tissue area (tubulin) or nuclear area (DAPI) for each optical section. Tubulin intensity per cell is calculated by normalizing the average Tubulin intensity to the nuclei number. The relative cell area was obtained by normalizing the volume of the respective tissue to nuclei number. Error bars represent one standard deviation, number of analyzed embryos = 3. e α-value changes after 2 h of 2 µM Nocodazole treatment (green; mean+SD = 0.082 ± 0.1) and in DMSO controls (blue; mean+SD = −0.004 ± 0.09). N = number of embryos, n = number of measured nanoparticles; P value calculated using unpaired equal variance two-tailed t test; **P = 0.0086.

Acknowledgments
This image is the copyrighted work of the attributed author or publisher, and ZFIN has permission only to display this image to its users. Additional permissions should be obtained from the applicable author or publisher of the image. Full text @ Commun Biol