|
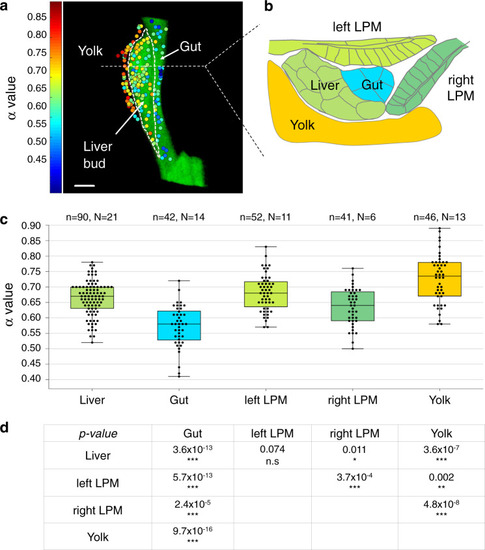
Viscoelastic mapping of the foregut region reveals different biomechanical properties of neighboring progenitor populations.a 2D projection of viscoelasticity map of the liver, gut, and yolk. The color scale on the left indicates cellular viscoelasticity: increasing blue values show more elastic tissues, while increasing red values represent more viscous tissues (n = 178 nanoparticles, N = 32 embryos). Scale bar: 20 µm. b Viscoelasticity map of the foregut region in a projection orthogonal to (a) and using color code corresponding to average α values for each tissue type, color scale bar as in (a). c Quantification of α values for different tissues shown in a box plot; n = number of analyzed particles, N = number of embryos. d Statistical comparison of α value distributions between different tissues. The table provides the P value calculated for each pair of tissues using a two-tailed equal variance Student’s t test. *P < 0.05, **P < 0.01, ***P < 0.001.
|