
- Title
-
An F0-based genetic assay in adult zebrafish for discovering modifier genes of an inherited cardiomyopathy
- Authors
- Ding, Y., Wang, M., Bu, H., Li, J., Lin, X., Xu, X.
- Source
- Full text @ Dis. Model. Mech.

Genetic testing identified GBT411/dnajb6 as a deleterious modifier for bag3 cardiomyopathy. (A,B) Levels of ejection fraction (EF) and fractional shortening (FS) (in %) of bag3e2/e2;sorbs2b−/−, bag3e2/e2;ano5a−/− and bag3e2/e2;rxraa−/− double-mutant fish compared to bag3e2/e2 single-mutant and WT control fish at 6 months; n=6-15, one-way ANOVA. (C) Survival (in %) of bag3e2/e2;GB411−/− double-mutant fish compared to single-mutant and WT control fish; n=15-24, log-rank test. (D) FS of bag3e2/e2;dnajb6b−/− double-mutant fish compared to single-mutant and WT control fish at 6 days dpf; n=6-7, one-way ANOVA. (E,F) Images of ventricular chamber outlines (E) and quantification of its size (F) of bag3e2/e2;GB411−/− double-mutant hearts at systolic stage compared to single mutants and WT controls, n=6. One-way ANOVA. Scale bar: 100 µm. *P<0.05. ns, not significant. |
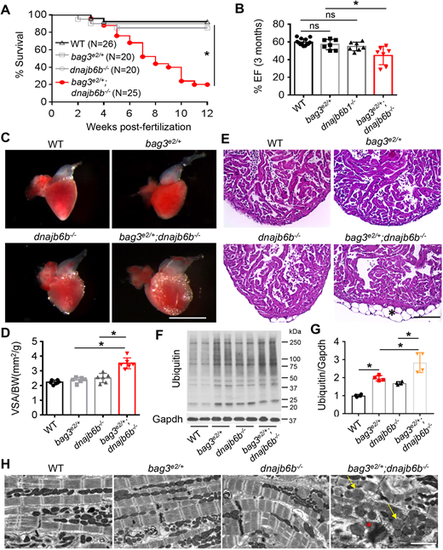
Genetic interaction between bag3e2/+ and dnajb6b−/− in adult zebrafish heart. (A) Survival (in %) of bag3e/+;GB411−/− double-mutant fish compared to single-mutant and WT control fish; n=25-40, log-rank test. (B) Ejection fraction (EF) (in %) of bag3e2/+;dnajb6b−/− double mutants compared to single mutants and WT controls at 3 months post fertilization; n=6-8, one-way ANOVA. (C-E) Bright-field images of dissected hearts (C) show significantly enlarged ventricular surface area (VSA) in bag3e2/+;dnajb6b−/− double-mutant fish. VSA normalized to body weight (BW) index is plotted in D. H&E staining of heart ventricles (E) highlights the obvious lipid accumulation phenotype (asterisk); n=3-4, one-way ANOVA. Scale bars: 1 mm (C), 100 µM (E). (F,G) Western blot (F) and quantification analysis (G) of ubiquitylated protein levels in heart lysates of bag3e2/+;dnajb6b−/− double-mutant fish compared to those of single-mutant and WT control fish at 3 months; n=4, one-way ANOVA. (H) Confirmative TEM images, showing mitochondrial swelling (arrows) and myofibril degeneration phenotypes (asterisk) the bag3e2/+;dnajb6b−/− double-mutant fish hearts at 3 months. Scale bar: 2 µM. *P<0.05; ns, not significant. PHENOTYPE:
|
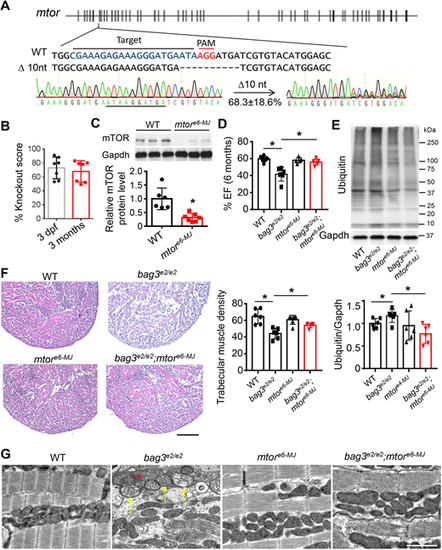
Injection of the predicted MMEJ-inducing mtor-sgRNA exerted salutary modifier effects on bag3 cardiomyopathy at F0. (A) Design of the predicted MMEJ-inducing sgRNA sequence targeted to the exon 6 within the mtor gene (mtore6-MJ). Injection of mtore6-MJ sgRNA generated frame-shift mutant alleles, with 68.3% predicted to result from microhomology recombination (10-nucleotide deletion). (B) The mtor gene KO score (in %) in mtore6-MJ-injected fish embryos at 3 dpf. (C) Western blotting and quantification analysis of mTOR protein in the mtore6-MJ fish compared to non-injected WT controls at 3 dpf; n=6, one way-ANOVA. (D) Ejection fraction (EF) of the mtore6-MJ-injected bag3e2/e2 fish (mtore6-MJ;bag3e2/e2) compared to bag3e2/e2 mutant alone, mtore6-MJ and non-injected WT controls at 6 months; n=6, one-way ANOVA. (E) Western blot (top panel) and quantification analysis (below) of ubiquitylated protein levels in mtore6-MJ-injected bag3e2/e2 fish hearts compared to those non-injected controls at 6 months; n=6, one-way ANOVA. (F) Representative H&E staining images of the apex area (left panel) and quantification of the trabecular muscle density (right panel) from the mtore6-MJ;bag3e2/e2 fish compared to those of corresponding controls at 6 months; n=6, one-way ANOVA. Scale bar: 100 µM. (G) Confirmative TEM images of mtore6-MJ-injected bag3e2/e2 fish hearts (bag3e2/e2;mtore6−MJ) compared to those of corresponding controls (WT, bag3e2/e2 and mtore6−MJ) demonstrate largely restored mitochondrial swelling (arrows) and myofibril degeneration (asterisk) in the mtore6-MJ-injected bag3e2/e2 fish at 6 months. Scale bar: 2 µM; *P<0.05. EXPRESSION / LABELING:
PHENOTYPE:
|
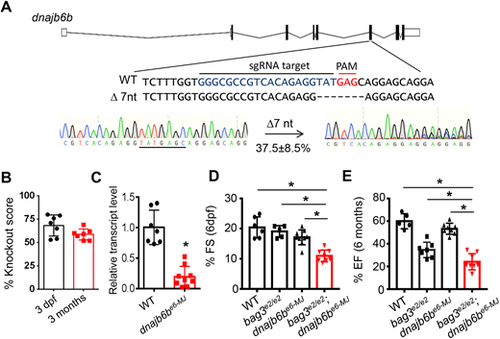
Injection of the predicted MMEJ-inducing dnajb6b-sgRNA into bag3e2/e2 F0 fish manifested severe cardiac dysfunction. (A) Design of the predicted MMEJ-based sgRNA sequence targeting the exon 6 of the dnajb6b gene (dnajb6be6-MJ). Injection of dnajb6be6-MJ into bag3e2/e2 fish (bag3e2/e2;dnajb6be6−MJ) generated frame-shift mutant alleles, with 37.5% predicted to result from microhomology recombination (7-nucleotide deletion). (B) Plotted is the dnajb6b gene knockout (KO) score (in %) of bag3e2/e2;dnajb6be6−MJ embryos at 3 dpf and fish at 3 months. (C) Transcript levels of dnajb6b in hearts of bag3e2/e2;dnajb6be6−MJ fish compared to those of non-injected controls at 3 months; n=10. Unpaired Student’s t-test. (D,E) Fraction shortening (FS) and ejection fraction (EF) in bag3e2/e2;dnajb6be6−MJ fish compared to that in bag3e2/e2 mutant, dnajb6be6-MJ or non-injected WT control fish at 6 dpf (embryonic) and 6 months (adult). n=5-8, one-way ANOVA. |

The predicted MMEJ-inducing dnajb6b-sgRNA-injected bag3e2/e2 F0 adult fish manifested several phenotypic traits that are similar to those in stable bag3e2/+;dnajb6b−/− double mutants. (A) Bright-field images of hearts (left panel) and bar graph showing ventricular surface area (VSA) normalized to body weight (BW) (right panel) of fish as indicated. dnajb6be6-MJ;bag3e2/e2 fish exhibited lipid accumulation in the heart (arrows), as well as enlarged VSA/BW levels; n=6, one-way ANOVA. Scale bar: 1 mm. (B) Western blot (top panel) and quantification analysis of ubiquitylated protein levels (bottom panel) in the dnajb6be6-MJ;bag3e2/e2 fish hearts compared to bag3e2/e2 mutant alone, dnajb6be6-MJ or non-injected WT controls at 6 months; n=4, one-way ANOVA. (C) Representative H&E staining of the apex area in fish as indicated (left panel) and quantification of the trabecular muscle density (right panel) in hearts of dnajb6be6-MJ;bag3e2/e2 fish at 6 months compared to that in corresponding controls. The arrow points to lipid droplets; n=6, one-way ANOVA. Scale bar: 100 µM. (D) Confirmative TEM images of dnajb6be6-MJ;bag3e2/e2 fish hearts compared to those of corresponding controls demonstrate severe mitochondrial swelling (arrows) and myofibril degeneration (asterisks) phenotypes that are similar to those detected in hearts of bag3e2/+;dnajb6b−/− double-mutant fish. Scale bar: 2 µM; *P<0.05. ns, not significant. PHENOTYPE:
|

Identification of myh9b as a new deleterious modifier gene for bag3 cardiomyopathy through predicted MMEJ-based genome editing at F0. (A) Ejection fraction (EF) of bag3e2/e2 fish at 6 months after injection with each of the eight predicted MMEJ-based sgRNAs targeting eight differentially expressed proteostasis/autophagy genes compared to bag3e2/e2 single-mutant and WT control fish at 6 months; n=4-11, one-way ANOVA. (B,C) Bright-field images of hearts (B) and bar graph (C) showing ventricular surface area (VSA) normalized to body weight (BW) in fish as indicated. The myh9bMJ-injected bag3e2/e2 fish (bag3e2/e2;myh9bMJ) exhibited increased levels of VSA/BW compared to that in the bag3e2/e2 mutant alone, myh9bMJ or non-injected WT controls at 6 months; n=6, one-way ANOVA. Scale bar: 1 mm. (D) Confirmative TEM images to compare hearts of bag3e2/e2;myh9bMJ fish to those of bag3e2/e2 mutant alone, myh9bMJ or non-injected WT controls at 6 months. Arrows indicate mitochondrial swelling; the asterisk indicates sarcomeric Z-disc aggregation. Scale bar: 2 µM; *P<0.05, ns, not significant. PHENOTYPE:
|
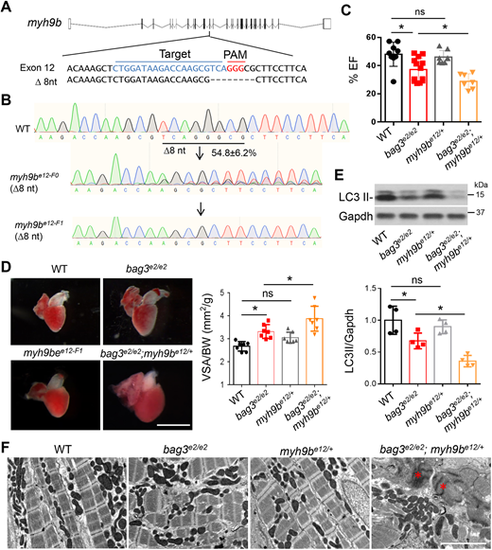
The stable myh9b heterozygous mutant deteriorated bag3 cardiomyopathy at adult stage. (A) Schematic of the predicted MMEJ-inducing myh9b genetic lesion of 8-nucleotides generated by injection of an sgRNA targeting sequences within the 12th exon. Dashed lines indicate an 8-nucleotide-long deletion. (B) Chromographs illustrating the sequences of the wild-type myh9b and the mutant alleles with the predicted 8-nucleotide-long deletion in F0 and F1 fish. (C) Quantification of cardiac function. Ejection fraction (EF) (in %) measured by using echocardiography in bag3e2/e2;myh9be12/+ double-mutant fish compared to single-mutant and WT control fish at 6 months; n=7-11, one-way ANOVA. (D) Left panel: Representative images of isolated hearts from fish as indicated. Right panel: Quantification of ventricular surface area (VSA) normalized to the body weight (BW) of fish at 6 months; n=7, one-way ANOVA. (E) Western blotting (top) and quantification LC3 II protein levels (bottom) of hearts from bag3e2/e2;myh9be12/+ double-mutant fish, bag3e2/e2, myh9be12/+ or WT control fish at 6 months. Levels of Gapdh were used as control. n=4, one-way ANOVA. (F) TEM images of bag3e2/e2;myh9be12/+ double-mutant fish hearts, bag3e2/e2, myh9be12/+ and WT controls at 6 months. Asterisks indicate Z-disc aggregation. Scale bar: 2 µM (D). *P<0.05. ns, not significant. |