FIGURE SUMMARY
Title

Dopamine Homeostasis Imbalance and Dopamine Receptors-Mediated AC/cAMP/PKA Pathway Activation are Involved in Aconitine-Induced Neurological Impairment in Zebrafish and SH-SY5Y Cells

Authors
Zhou, J., Peng, C., Li, Q., Yan, X., Yang, L., Li, M., Cao, X., Xie, X., Chen, D., Rao, C., Huang, S., Peng, F., Pan, X.
Source
Full text @ Front Pharmacol

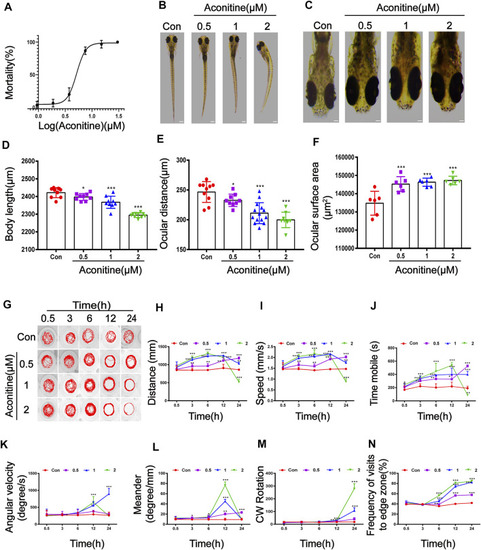
Morphological and swimming behavior changes of zebrafish larvaes after aconitine exposure. (A) Mortality of zebrafish larvaes exposed to aconitine at different concentrations (0.937–30 μM), n = 30. (B–F) Effects of exposure to aconitine on morphological parameters of zebrafish larvaes. Images were taken under a stereomicroscope (32× or 100×), n = 15. (D) Body length (μm). (E) Ocular distance (μm). (F) The surface area of eyes (μm2). (G–N) Effects of exposure to aconitine on neurobehavioral of zebrafish larvaes, n = 10. (G) Behavior trajectories. (H) Distance travelled (mm). (I) Movement speed (mm/s). (J) Time mobile (s). (K) Angular velocity (degree/s). (L) Meander (degree/mm). (M) CW rotation. (N) Frequency of visits to edge zone (%). The values are expressed as mean ± SD. *p < 0.05, **p < 0.01, ***p < 0.001 vs. control groups.

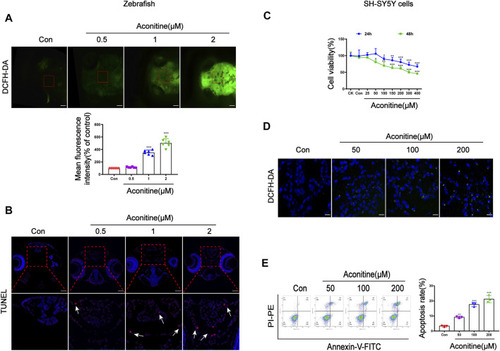
Cell damage of zebrafish larvaes and SH-SY5Y cells caused by aconitine. (A) The images of aconitine-treated larvaes by DCFH-DA (100×), n = 6. (B) The images of aconitine-exposed larvaes by TUNEL assay (100×), n = 3. (C) Cell viability of SH-SY5Y cells after 24 h or 48 h aconitine exposure, n = 8. (D) The images of aconitine-treated SH-SY5Y cells by DCFH-DA (200×), n = 3. (E) SH-SY5Y cell apoptosis aconitine-induced based on Annexin V/PI double staining by flow cytometry, n = 3. All photographs were taken under a stereoscopic fluorescence microscope or confocal microscope. The values are expressed as mean ± SD. *p < 0.05, **p < 0.01, ***p < 0.001 vs. control groups.

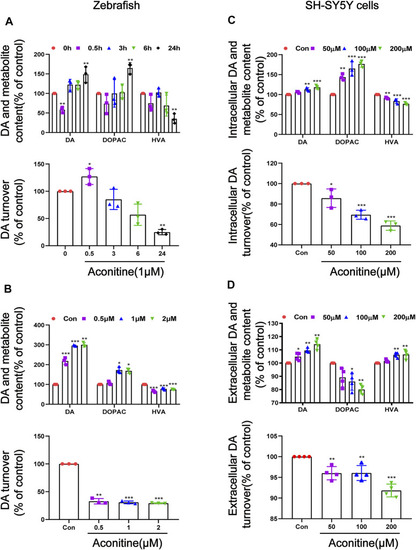
Alteration of dopamine and its metabolites levels in zebrafish larvaes and SH-SY5Y cells after aconitine exposure. (A) Dopamine, DOPAC and HVA levels and the turnover of dopamine after larvaes were treated with 1 μM aconitine for 0.5, 3, 6, and 24 h, respectively. (B) Dopamine, DOPAC and HVA contents and the turnover of dopamine after larvaes were incubated with aconitine at doses of 0.5, 1 and 2 μM for 24 h. (C) Intracellular dopamine, DOPAC and HVA levels and the turnover of dopamine at doses of 50, 100, and 200 μM for 24 h in SH-SY5Y cells. (D) Extracellular dopamine, DOPAC and HVA levels and the turnover of dopamine at doses of 50, 100, and 200 μM for 24 h in SH-SY5Y cells. The values are expressed as mean ± SD, n = 3. *p < 0.05, **p < 0.01, ***p < 0.001 vs. control groups.

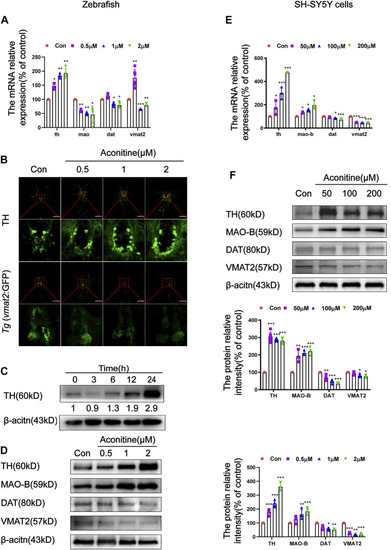
Effects of aconitine on TH, MAO, DAT and VMAT2 expressions in zebrafish larvaes and SH-SY5Y cells. (A) The mRNA expressions of th, mao, dat, vmat2 with aconitine exposure in zebrafish larvaes, n = 6. (B) TH and VMAT2 positive cells were investigated using immunostaining and Tg (vmat2:GFP) transgenic zebrafish larvaes, respectively, n = 5. (C) Effect of different exposure times of 1 μM aconitine on the protein expression of TH, n = 4. (D) The protein levels of TH, MAO-B, DAT and VMAT2 with aconitine exposure in zebrafish larvaes, n = 4. (E) The mRNA expressions of th, mao-b, dat, vmat2 with aconitine exposure in SH-SY5Y cells, n = 3. (F) The protein levels of TH, MAO-B, DAT, and VMAT2 with aconitine exposure in SH-SY5Y cells, n = 7. All photographs in which the green fluorescence represented the immune-reactive cells were taken under a confocal microscope (100×). The values are expressed as mean ± SD. *p < 0.05, **p < 0.01, ***p < 0.001 vs. control groups.

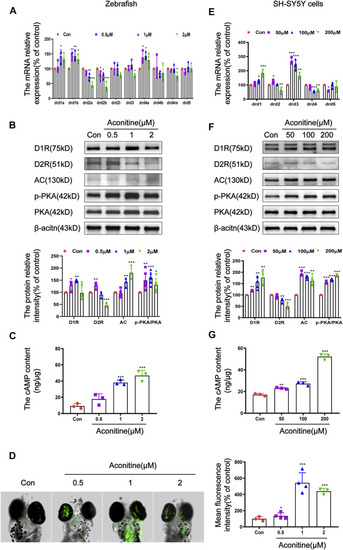
Regulation of DR-mediated AC/cAMP/PKA signalling pathway by aconitine in zebrafish larvaes and SH-SY5Y cells. (A) Expression of DR mRNA with aconitine exposure in zebrafish larvaes, n = 3. (B) D1R, D2R, AC, p-PKA, and PKA protein expressions with aconitine exposure in zebrafish larvaes, n = 7. (C) The cAMP contents were examined with aconitine exposure by ELISA assays in zebrafish larvaes, n = 3. (D) Changes of intracellular Ca2+ after treatment with aconitine in zebrafish larvaes, n = 5. (E) Expression of DR mRNA with aconitine exposure in SH-SY5Y cells, n = 5. (F) D1R, D2R, AC, p-PKA and PKA protein expressions with aconitine exposure in SH-SY5Y cells, n = 5. (G) The cAMP contents were examined with aconitine exposure by ELISA assays in SH-SY5Y cells, n = 3. All photographs were taken under a confocal microscope (100×). The values are expressed as mean ± SD. *p < 0.05, **p < 0.01, ***p < 0.001 vs. control groups.

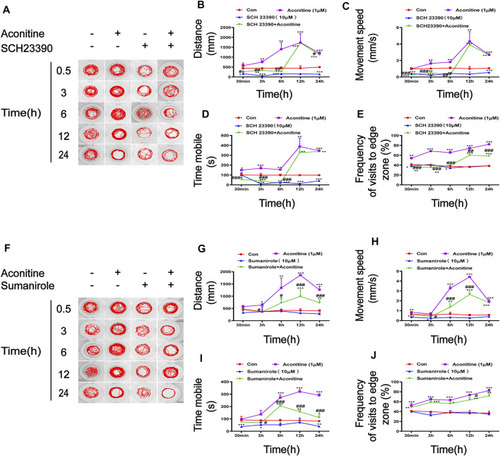
FIGURE 6. Effects of SCH23390 and sumanirole on behavioral changes induced by aconitine in zebrafish larvaes. (A–E) SCH23390 inhibited aconitine-stimulated excitatory behaviors, n = 10. (F–J) Sumanirole suppressed aconitine-induced excitatory behaviors, n = 10. The values are expressed as mean ± SD. *p < 0.05, **p < 0.01, ***p < 0.001 vs. control groups. #p < 0.05, ##p < 0.01, ###p < 0.001 vs. aconitine-treated groups.

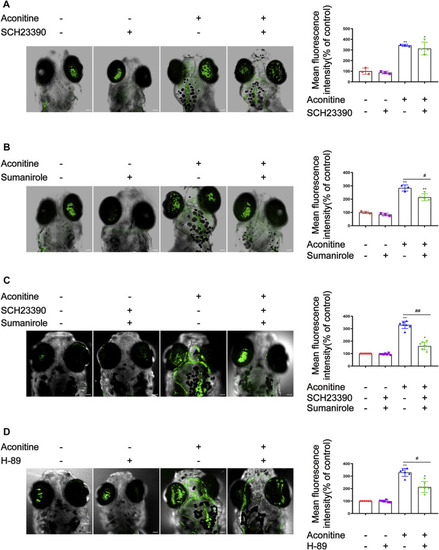
Effects of SCH23390, sumanirole and H-89 on intracellular Ca2+ changes induced by aconitine in zebrafish larvaes. (A) Effects of SCH23390 on intracellular Ca2+ changes induced by aconitine. (B) Sumanirole suppressed aconitine-induced the increase of intracellular Ca2+. (C) Pretreatment with SCH23390 and sumanirole inhibited the rise of intracellular Ca2+ aconitine-stimulated. (D) H-89 inhibited the increase of intracellular Ca2+ induced by aconitine. All photographs were taken under a confocal microscope (100×). The values are expressed as mean ± SD, n = 8. *p < 0.05, **p < 0.01, ***p < 0.001 vs. control groups. #p < 0.05, ##p < 0.01, ###p < 0.001 vs. aconitine-treated groups.

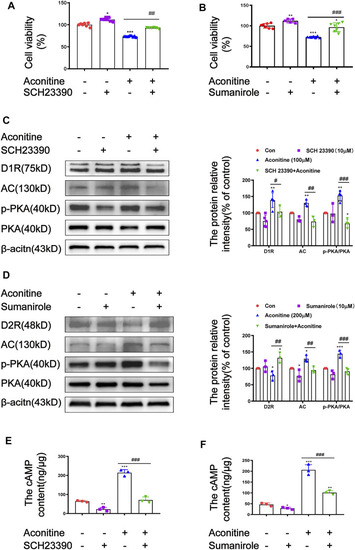
FIGURE 8. Effects of SCH23390 and sumanirole on aconitine-induced the activation of AC/cAMP/PKA pathway in SH-SY5Y cells. (A–B) SCH23390 and sumanirole inhibited aconitine-induced cytotoxicity in SH-SY5Y cells, respectivevly, n = 9. (C–F) SCH23390 and sumanirole suppressed aconitine-mediated the activation of AC/cAMP/PKA pathway, n = 5. The values are expressed as mean ± SD. *p < 0.05, **p < 0.01, ***p < 0.001 vs. control groups. #p < 0.05, ##p < 0.01, ###p < 0.001 vs. aconitine-treated groups.

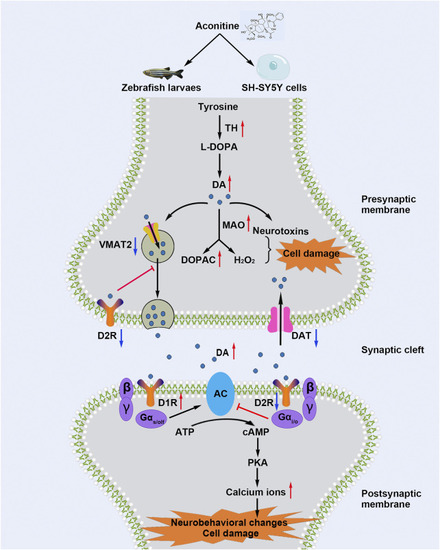
Schematic diagram shows that aconitine induces neurological impairment via dopamine homeostasis disruption and dopamine receptors-mediated AC/cAMP/PKA pathway activation in zebrafish larvaes and SH-SY5Y cells.

Acknowledgments
This image is the copyrighted work of the attributed author or publisher, and ZFIN has permission only to display this image to its users. Additional permissions should be obtained from the applicable author or publisher of the image. Full text @ Front Pharmacol