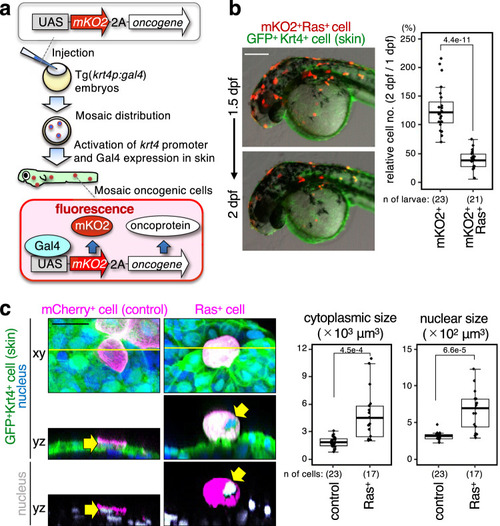
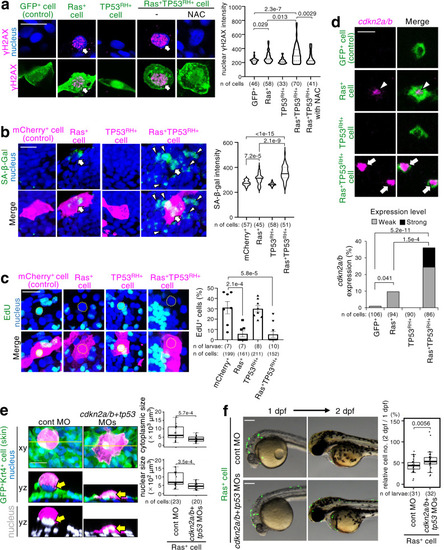
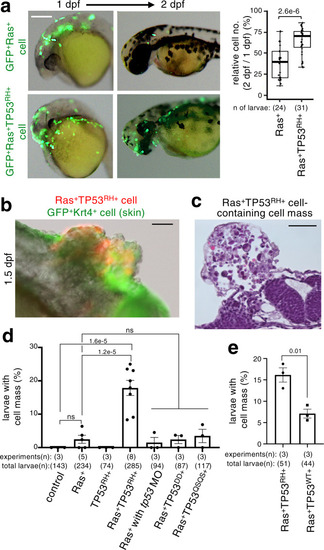
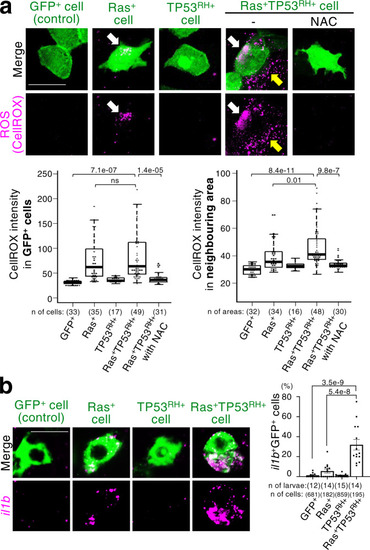
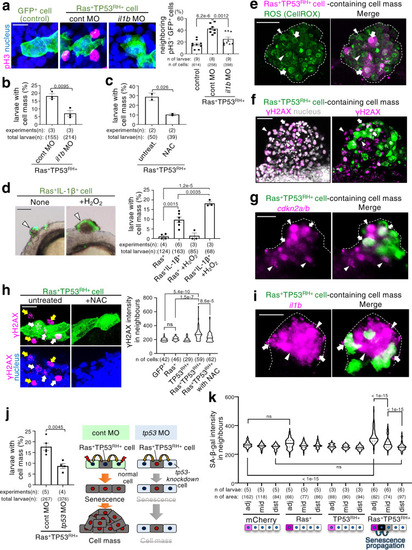
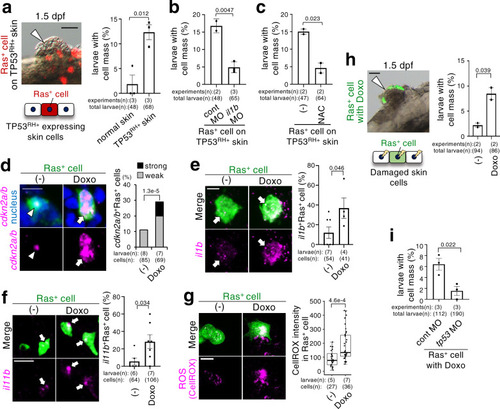
Newly generated Ras<sup>G12V</sup> cell surrounded by normal cells is eliminated from zebrafish epithelia.

a Schematic illustration of experimental introduction of fluorescent oncogenic cells in zebrafish larval skin in a mosaic manner through the Gal4/UAS system. b Mosaic RasG12V cell disappears from larval skin. Representative images show the larvae with mosaically introduced cells expressing mKO2 with RasG12V (mKO2+Ras+ cells) (red). Skin cells were visualised with krt4p:gal4; UAS:EGFP (green). Scale bar: 200 μm. Bottom box plots of relative mKO2+ cell number of 2 days postfertilisation (dpf)/1 dpf ratio show first and third quartile, median is represented by a line, whiskers indicate the minimum and maximum, and outliers are shown as dots outside of the box. Each dot represents one larva. Unpaired two-tailed t-test was used. Note that oncogenic cells were introduced not only to the head region but also to the trunk and tail regions, and their disappearance occurred in all areas. c Cytoplasmic and nuclear swelling occurs in mosaic RasG12V cells. Representative confocal images show mosaic mCherry+ (control) or mCherry+RasG12V (Ras+) cells (magenta) and nucleus (upper; blue, lower; grey) in the larvae. Arrows indicates nuclei of mCherry+ cells. Scale bar: 20 μm. Box plots of estimated nuclear or cytoplasmic size (μm3) show first and third quartile, median is represented by a line, whiskers indicate the minimum and maximum, and outliers are shown as dots outside of the box. Each dot represents one cell. Unpaired two-tailed t-test was used. Source data are provided as a Source Data file.

EXPRESSION / LABELING:
Gene:
Fish:
Anatomical Term:
Stage: Long-pec

Newly generated oncogenic cells undergo cellular senescence.

ad Representative confocal images show cells with GFP (a, d) or mCherry (b, c) alone (control), or with RasG12V, TP53R175H, or RasG12V and TP53R175H (GFP+, mCherry+, Ras+, TP53RH+, or Ras+TP53RH+ cells) (green in a, d, magenta in b, c). Scale bar: 20 μm. In a, arrows indicate γH2AX (magenta)-accumulated GFP+ oncogenic cells. Violin plots of γH2AX intensities in GFP+ cells show 75th, 50th (median), and 25th percentiles. In b, SA-β-gal was visualised by SPiDER-βGal (green). Arrowheads indicate SA-β-gal-expressing mCherry+ oncogenic cells, and arrows indicate cells SA-β-gal-expressing neighbouring cells. Violin plots of SA-β-gal intensities in mCherry+ cells show 75th, 50th (median), and 25th percentiles. In c, EdU+ cells (green) were observed in mCherry+ or TP53RH+ cells, but not Ras+ or Ras+TP53RH+ cells (magenta). Yellow broken lines: nuclei of mCherry+ cells. Bar plots show EdU+mCherry+ cells (mean ± SEM). Each dot represents one larva. A two-tailed one-way ANOVA test with Sidak correction (a, b, c) was used. In d, fluorescent in situ hybridization visualised cdkn2a/b mRNA (magenta). Arrows or arrowheads indicates cells expressing cdkn2a/b weakly or strongly, respectively. Bottom graphs show percentages of GFP+ cells with weak or strong cdkn2a/b expression. Fisher’s exact test with Bonferroni correction was used. e Representative confocal images show cells expressing mKO2+RasG12V (Ras+) (magenta) and nucleus (upper: blue, lower: grey). Skin cells visualised with krt4p:gal4; UAS:EGFP (green). Scale bar: 20 μm. Box plots of estimated nuclear or cytoplasmic size (μm3) show first and third quartile, median is represented by a line, whiskers indicate the minimum and maximum. Each dot represents one cell. Unpaired two-tailed t-test was used.f Representative images show larvae with GFP+RasG12V (Ras+) cells (green) with control MO or cdkn2a/b + tp53 MOs. Scale bar: 200 μm. Box plots of relative Ras+ cell number between 2/1 dpf ratio show first and third quartile, median is represented by a line, whiskers indicate the minimum and maximum, and outliers are shown as dots outside of the box. Each dot represents one larva. Unpaired two-tailed t-test was used. Source data are provided as a Source Data file.

TP53<sup>R175H</sup> mutation attenuates mosaic Ras<sup>G12V</sup> cell elimination and stimulates heterogeneous cell mass formation.

a Mosaic RasG12VTP53R175H cells remain in larval skin. Representative images show larvae with mosaically introduced GFP+RasG12V (GFP+Ras+) or GFP+RasG12VTP53R175H (GFP+Ras+TP53RH+) cells (green). Scale bar: 200 μm. Box plots of relative GFP+ cell number of 2 dpf/1 dpf ratio show first and third quartile, median is represented by a line, whiskers indicate the minimum and maximum. Each dot represents one larva. Unpaired two-tailed t-test was used. be TP53 gain of function, but not loss of function, stimulates heterogeneous cell mass formation. In b, representative images show cell mass in the trunk region of larvae with mosaically introduced mKO2+RasG12VTP53R175H (Ras+TP53RH+) cells (red) at 1.5 dpf. Skin surface layer cells were visualised with krt4p:gal4; UAS:EGFP (green). In c, representative image of haematoxylin and eosin staining of cell mass in the trunk region of larvae with mosaically introduced Ras+TP53+ cells. Scale bar: 50 μm. Graph in d and e shows the percentage of 1.5 dpf embryos with cell mass (Means ± SEM). Each dot represents an independent experimental result. In d, A two-tailed one-way ANOVA test with Sidak correction was used. In e, Unpaired two-tailed t-test was used. Note that cell mass formation was induced not only in the head region but also in the trunk and tail regions. Source data are provided as a Source Data file.

Additional TP53<sup>R175H</sup> mutation reinforces SASP.

a A SASP factor ROS is detected in mosaic RasG12V and RasG12VTP53R175H cells and RasG12VTP53R175H cell neighbours. Representative confocal images show ROS-probe (CellRox DeepRed (magenta))-stained larvae with mosaically introduced cells expressing GFP alone (control) or with RasG12V, TP53R175H, or both RasG12V and TP53R175H (GFP+, Ras+, TP53RH+, or Ras+TP53RH+ cells) (green). White arrows indicate ROS in GFP+ oncogenic cells. Yellow arrows indicate ROS in the neighbouring area. NAC treatment reduces ROS. Scale bar: 20 μm. Box plots of CellROX intensities in GFP+ cells or neighbouring area (20 μm radius around GFP+ cells) show first and third quartile, median is represented by a line, whiskers indicate the minimum and maximum, and outliers are shown as dots outside of the box. Each dot represents one cell or one area. A two-tailed one-way ANOVA test with Sidak correction was used. b RasG12V and TP53R175H synergistically promote the expression of SASP factors, interleukin-1β (il1b). Representative confocal images show fluorescence in situ hybridization of il1b mRNA (magenta) in larvae with mosaically introduced cells expressing GFP alone (control) or with RasG12V, TP53R175H, or both RasG12V and TP53R175H (GFP+, Ras+, TP53RH+, or Ras+TP53RH+ cells) (green). Scale bar: 20 μm. Bar plots show il1b+GFP+ cells (mean ± SEM). Each dot represents one larva. A two-tailed one-way ANOVA test with Sidak correction was used. Source data are provided as a Source Data file.

SASP-mediated senescence propagation is involved in Ras<sup>G12V</sup>TP53<sup>R175H</sup> cell-driven cell mass formation.

a Representative confocal images show phospho-histoneH3 (pH3) (magenta) and nucleus (blue) in the larvae with GFP+ (control) or Ras+TP53+ cells (green) with control or il1b MO. Scale bar: 20 μm. Graph shows the percentage of GFP+ cells with pH3+ neighbours (mean ± SEM). b, c Larvae with Ras+TP53RH+ cells with control or il1b MO (b) or untreated or treated with NAC (c). Graph shows the percentage of 1.5 dpf embryos with cell mass (mean ± SEM). d Representative images show cells co-expressing RasG12V and zebrafish Il1b (Ras+IL-1β+cells) (green) with or without H2O2 treatment. Scale bar: 50 μm. Graph shows the percentage of 1.5 dpf embryos with cell mass (mean ± SEM). Each dot in graph (a-d) represents an independent experimental result. e–g, i Representative images show ROS (e; green), γH2AX (f; magenta), cdkn2a/b mRNA (g; magenta), or il1b mRNA (i; magenta) and nucleus (f; grey) in cell mass on the larvae with Ras+TP53RH+ cells (e; magenta, f, g, i; green). Dot lines surround cell mass. Scale bar: 50 μm. h Representative confocal images show γH2AX (magenta) and nucleus (blue) in larvae with Ras+TP53RH+ cells (green) untreated or treated with NAC. Scale bar: 20 μm. Violin plots of γH2AX intensities in neighbours (<20 μm radius from GFP+, Ras+, TP53RH+, or Ras+TP53RH+ cells) show 75th, 50th (median), and 25th percentiles. j Schematic illustration (right) shows experimental inhibition of secondary senescence in neighbouring cells. Larvae with Ras+TP53RH+cells were injected with control or tp53 MO. Graph show percentage of 1.5 dpf embryos with cell mass (means ± SEM). k Violin plots of SA-β-gal intensities in neighbouring cells around mCherry+ cells show 75th, 50th (median), and 25th percentiles. adj, mid, and dist indicates SA-β-gal activity-positive adjacent cells (<20 μm radius from the double-mutant cells), second adjacent cells (20–40 μm radius), and distant cells (more than 40-μm radius). A two-tailed one-way ANOVA test with Tukey’s correction (a) or Sidak correction (d, h, k) or unpaired two-tailed t-test (b, c, j) was used. Source data are provided as a Source Data file.

Mosaic Ras<sup>G12V</sup> cells stimulate cell mass formation in damaged skin.

a Representative images show cell mass in Tg(krt4p: gal4; UAS:G43EGFP-TP53R175H) larval head region with mCherry+Ras+ (Ras+) cells (red). Graph shows percentage of embryos with cell mass (mean ± SEM). b, c Tg(krt4p: :gal4; UAS:G43EGFP-TP53R175H) larvae with Ras+ cells with control or il1b MO (b) or untreated or treated with NAC (c). Graph shows the percentage of 1.5 dpf embryos with cell mass (mean ± SEM). Each dot in graph (ac) represents an independent experimental result. dg Doxorubicin promotes senescence and SASP factor production in mosaic Ras+ cells. In d, representative images show fluorescence in situ hybridization for cdkn2a/b mRNA (magenta) in Ras+ cells (green) with or without doxorubicin treatment, and nucleus (blue). Arrow and arrowhead indicate cdkn2a/b+Ras+ cells weakly or strongly, respectively. Graph shows percentage of cdkn2a/b+Ras+ cells. In ef, representative images show fluorescence in situ hybridization for il1b (e) or il11b mRNA (f) (magenta) in Ras+ cells (green) with or without doxorubicin treatment. Arrows indicate il1b+Ras+ or il11b+RasG12Vcells. Graph shows percentage of il1b+Ras+ or il11b+RasG12V cells (mean ± SEM). Each dot represents one larva. In g, representative images show ROS-probe, CellROX (magenta), -stained larvae with Ras+ cells (green) with or without doxorubicin treatment. Box plots of CellROX relative intensities in Ras+ cells show first and third quartile, median is represented by a line, whiskers indicate the minimum and maximum. Each dot represents one cell. h Representative images show cell mass in the head region of doxorubicin-treated larvae with GFP+Ras+ (Ras+) cells (green). Right graph shows percentage of embryos with cell mass (mean ± SEM). i Doxorubicin-treated larvae with Ras+ cells with control or tp53 MO. Graph shows percentage of 1.5 dpf embryos with cell mass (mean ± SEM). Each dot in graph (h, i) represents an independent experimental result. Note that cell mass formation was induced not only in the head but also in the trunk and tail in TP53R175H-expressing and doxorubicin-treated skin. Scale bar: 50 (a, h) or 10 (dg) μm. Unpaired two-tailed t-test (ac, ei) or Fisher’s exact test with Benjamini–Hochberg correction (d) was used. Source data are provided as a Source Data file.

Schematic illustration of the roles and regulation of cellular senescence during primary tumorigenesis.

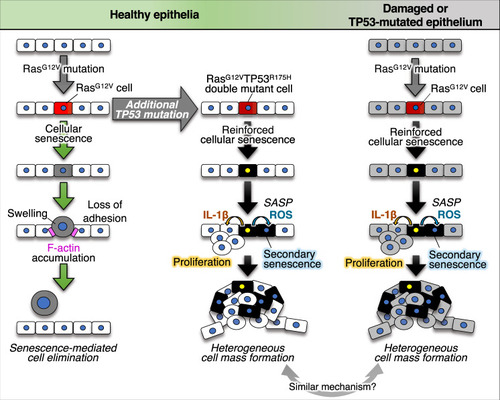
A newly emerged oncogenic cell becomes senescent and is eliminated from the epithelia. Additional TP53 mutation and tissue damage switches oncogene-induced senescence from suppressor to driver during primary tumorigenesis.

ZFIN is incorporating published figure images and captions as part of an ongoing project. Figures from some publications have not yet been curated, or are not available for display because of copyright restrictions.

ZFIN is incorporating published figure images and captions as part of an ongoing project. Figures from some publications have not yet been curated, or are not available for display because of copyright restrictions.

ZFIN is incorporating published figure images and captions as part of an ongoing project. Figures from some publications have not yet been curated, or are not available for display because of copyright restrictions.

EXPRESSION / LABELING:
Gene:
Fish:
Anatomical Term:
Stage: Long-pec

ZFIN is incorporating published figure images and captions as part of an ongoing project. Figures from some publications have not yet been curated, or are not available for display because of copyright restrictions.

EXPRESSION / LABELING:
Gene:
Fish:
Anatomical Term:
Stage: Long-pec
Acknowledgments
This image is the copyrighted work of the attributed author or publisher, and ZFIN has permission only to display this image to its users. Additional permissions should be obtained from the applicable author or publisher of the image. Full text @ Nat. Commun.