|
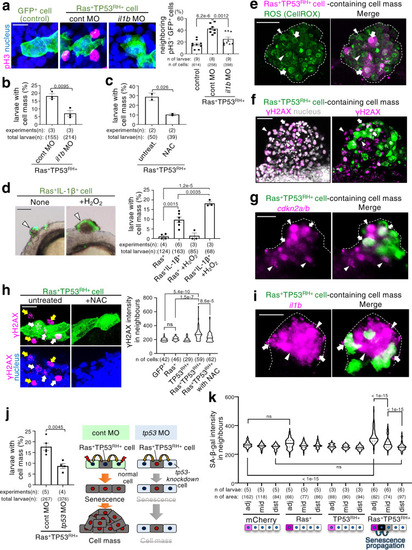
SASP-mediated senescence propagation is involved in Ras<sup>G12V</sup>TP53<sup>R175H</sup> cell-driven cell mass formation.a Representative confocal images show phospho-histoneH3 (pH3) (magenta) and nucleus (blue) in the larvae with GFP+ (control) or Ras+TP53+ cells (green) with control or il1b MO. Scale bar: 20 μm. Graph shows the percentage of GFP+ cells with pH3+ neighbours (mean ± SEM). b, c Larvae with Ras+TP53RH+ cells with control or il1b MO (b) or untreated or treated with NAC (c). Graph shows the percentage of 1.5 dpf embryos with cell mass (mean ± SEM). d Representative images show cells co-expressing RasG12V and zebrafish Il1b (Ras+IL-1β+cells) (green) with or without H2O2 treatment. Scale bar: 50 μm. Graph shows the percentage of 1.5 dpf embryos with cell mass (mean ± SEM). Each dot in graph (a-d) represents an independent experimental result. e–g, i Representative images show ROS (e; green), γH2AX (f; magenta), cdkn2a/b mRNA (g; magenta), or il1b mRNA (i; magenta) and nucleus (f; grey) in cell mass on the larvae with Ras+TP53RH+ cells (e; magenta, f, g, i; green). Dot lines surround cell mass. Scale bar: 50 μm. h Representative confocal images show γH2AX (magenta) and nucleus (blue) in larvae with Ras+TP53RH+ cells (green) untreated or treated with NAC. Scale bar: 20 μm. Violin plots of γH2AX intensities in neighbours (<20 μm radius from GFP+, Ras+, TP53RH+, or Ras+TP53RH+ cells) show 75th, 50th (median), and 25th percentiles. j Schematic illustration (right) shows experimental inhibition of secondary senescence in neighbouring cells. Larvae with Ras+TP53RH+cells were injected with control or tp53 MO. Graph show percentage of 1.5 dpf embryos with cell mass (means ± SEM). k Violin plots of SA-β-gal intensities in neighbouring cells around mCherry+ cells show 75th, 50th (median), and 25th percentiles. adj, mid, and dist indicates SA-β-gal activity-positive adjacent cells (<20 μm radius from the double-mutant cells), second adjacent cells (20–40 μm radius), and distant cells (more than 40-μm radius). A two-tailed one-way ANOVA test with Tukey’s correction (a) or Sidak correction (d, h, k) or unpaired two-tailed t-test (b, c, j) was used. Source data are provided as a Source Data file.
|