
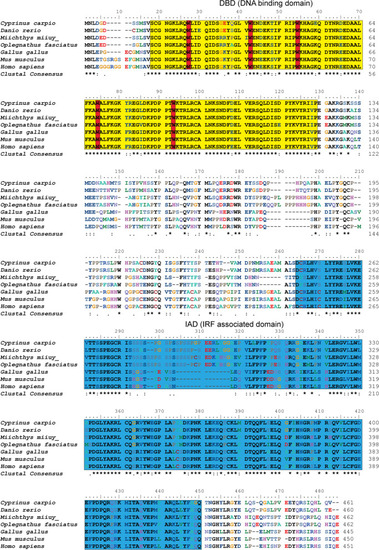
Multiple alignment IRF4 protein sequences in different species. The sequences were aligned using the ClustalW method. Identical (*) and similar (: or .) residues are indicated; the predicted domains from SMART Server software have been indicated by colored boxes: the yellow denotes the DBD and the blue denotes the IAD. Five tryptophan (W) residues are boxed in red. The GenBank accession numbers of the genes are listed in Table |
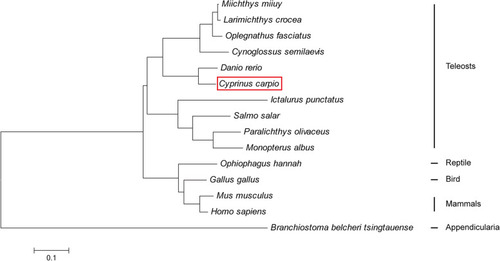
Phylogenetic analysis of IRF4 protein sequences from different species. The phylogenetic tree was produced by the neighbour-joining method in MEGA 5.0. The red frame shows the common carp IRF4 |
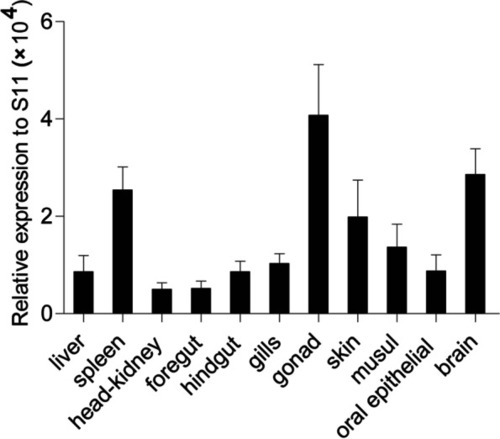
Tissue-specific expression of ccIRF4 under normal physiological conditions. CcIRF4 mRNA expression in the liver, spleen, head kidney, gills, skin, foregut, hindgut, buccal epithelium, gonad, muscle and brain were determined by real-time PCR. Gene expression levels were normalized using the 40S ribosomal protein S11 mRNA, |
Expression analysis of ccIRF4 in response to Poly I:C challenge |
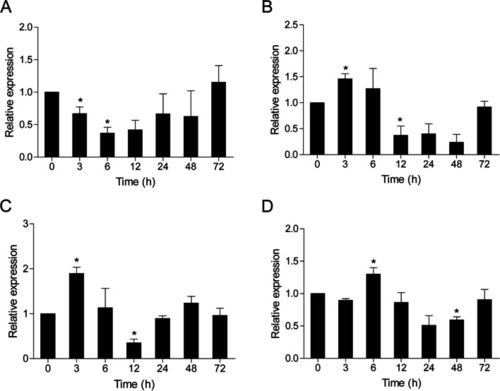
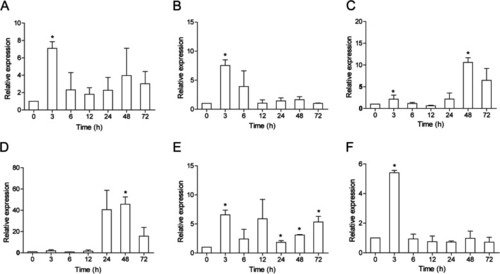
Expression analysis of ccIRF4 in response to A. hydrophila challenge in vivo. Total RNA was extracted from the spleen (A), head kidney (B), foregut (C) and hindgut (D) at 0 (as control), 3, 6, 12, 24, 48 and 72 h post injection for real-time PCR. Expression was normalized using the 40S ribosomal protein S11 (n = 3, mean ± SD, *P < 0.05) |
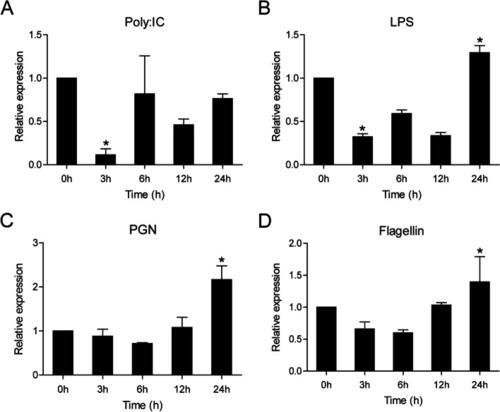
Expression levels of ccIRF4 in the HKLs upon different stimulation. The cells were collected at 0 (as control), 3, 6, 12 and 24 h post-infection for RNA extraction and real-time PCR analysis. Expression was normalized using the 40S ribosomal protein S11 (n = 3, mean ± SD, *P < 0.05) |
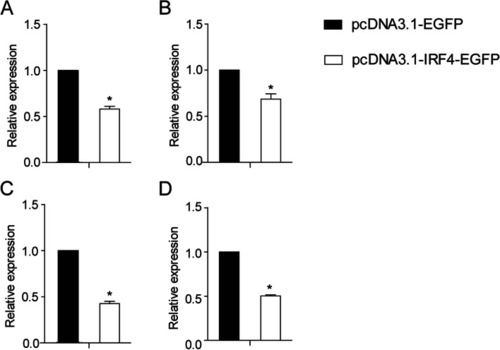
Relative expression of IFN (A), PKR (B), Viperin (C) and IL1-β (D) in ccIRF4-transfected EPC cells. Expression was normalized to β-actin (n = 3, mean ± SD, *P < 0.05) |
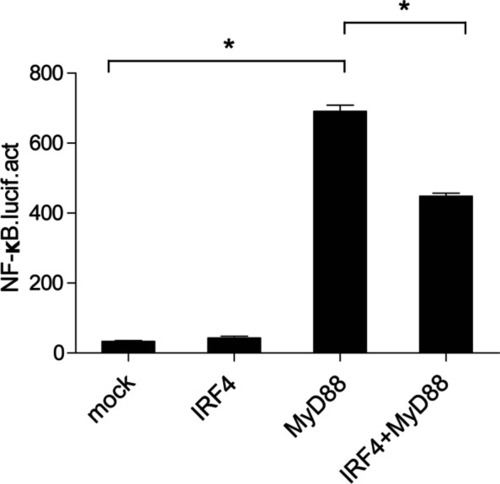
CcIRF4 negatively regulates the NF-κB pathway through MyD88. 293 T cells were cotransfected with the NF-κB reporter gene, together with ccIRF4 and MyD88 expression plasmids. Luciferase activity was measured after 48 h and determined against Renilla luciferase activity (mean ± SD, * |