
Image
|
Figure Caption
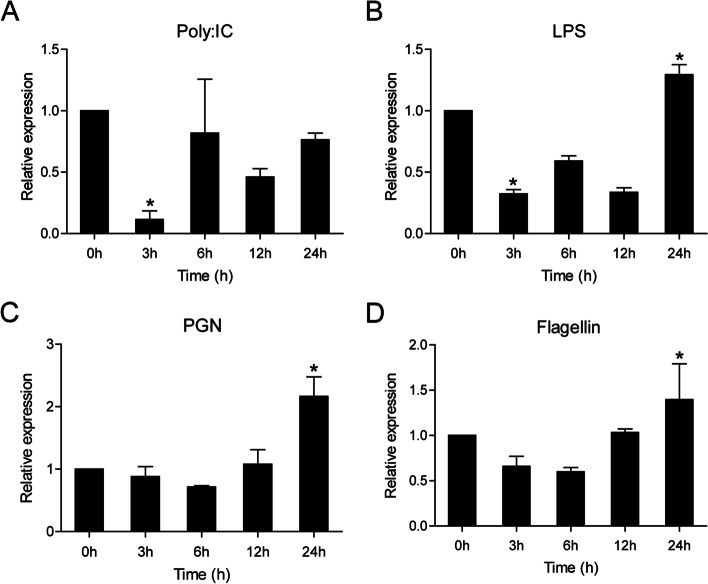
Fig. 6
Expression levels of ccIRF4 in the HKLs upon different stimulation. The cells were collected at 0 (as control), 3, 6, 12 and 24 h post-infection for RNA extraction and real-time PCR analysis. Expression was normalized using the 40S ribosomal protein S11 (n = 3, mean ± SD, *P < 0.05)
Acknowledgments
This image is the copyrighted work of the attributed author or publisher, and
ZFIN has permission only to display this image to its users.
Additional permissions should be obtained from the applicable author or publisher of the image.
Full text @ BMC Vet. Res.