FIGURE SUMMARY
Title

V3 Interneurons are Active and Recruit Spinal Motor Neurons During In Vivo Fictive Swimming in Larval Zebrafish

Authors
Wiggin, T.D., Montgomery, J.E., Brunick, A.J., Peck, J.H., Masino, M.A.
Source
Full text @ eNeuro

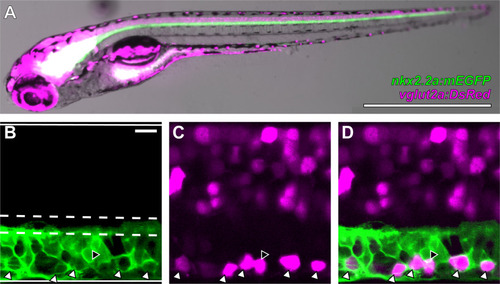
V3-INs are identified by co-localization of vglut2a:DsRed and nkx2.2a:mEGFP transgene expression in neurons located in the ventromedial spinal cord. A, Whole-mount Tg(nkx2.2a:mEGFP)vu17;Tg(vglut2a:DsRed)nns9 double transgenic zebrafish larva. B–D, A representative single confocal optical section of the spinal cord exhibiting: (B) nkx2.2a:mEGFP expression, (C) vglut2a:DsRed expression, and (D) overlayed nkx2.2a:mEGFP and vglut2a:DsRed expression. The boundaries of the spinal cord and central canal are illustrated by solid and dashed white lines, respectively, in panel B. White triangles indicate neurons that co-express both transgenes and the black triangle indicates the only vglut2a:DsRed neuron ventral to the central canal that did not co-express nkx2.2a:mEGFP in the field of view. Scale bars: 1 mm (A) and 10 μm (B–D).

Distribution of V3-IN cell bodies in the spinal cord. A, Maximum intensity projection of a confocal stack of the spinal cord of a 5 dpf Tg(vglut2a:DsRed)nns9 zebrafish larva. The dashed white outline indicates the region of the cord in which cells were quantified. The solid white outline is the region of the image shown at higher magnification in B. B, A higher magnification field of view. White circles indicate V3-INs, black triangles indicate dorsal root ganglion neurons located lateral to the spinal cord. C, Distribution of all quantified V3-INs (red dots) projected in the transverse plane of the spinal cord. The schematic outline of the spinal cord (solid gray line), as well as the location of the central canal (cc) and Mauthner axon (m), are approximate. The heavy black line indicates the line of best fit that best describes the axis of the V3-IN population. D–G, The windowed moving average of V3-IN density along the rostrocaudal axis (D; window width: 250 μm), mediolateral axis (E; window width: 15% SC radius), dorsoventral axis (F; window width: 15% SC radius), and along the population axis (G; window width: 15% SC radius). Black lines are the mean, gray area indicates the SD. SC: spinal cord. Scale bar: 100 μm (A) and 19 μm (B).

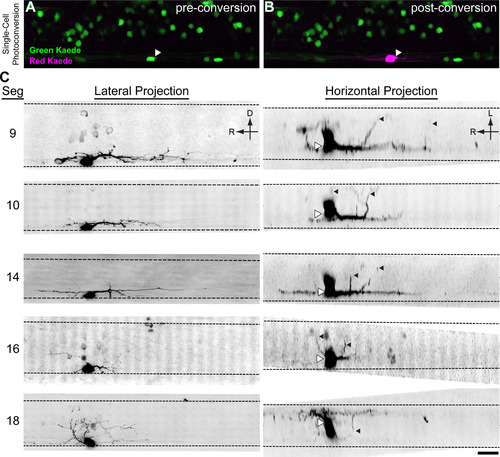
V3-INs are descending, bilaterally projecting cells. Kaede was expressed in vglut2a-expressing neurons in Tg(vglut2a:Gal4ff)nns20;Tg(UAS:Kaede)s1999t double transgenic larvae (A). A single V3-IN was exposed to UV laser light, converting the Kaede protein from green fluorescence to red (B). C, Inverted contrast projections of Kaede-red fluorescence in five neurons. Each row of images is a neuron shown in a lateral z-projection (left) and horizontal z-projection (right). On the horizontal projections, the center of the cell body is indicated with white triangles to account for optical bloom and contralateral projections are indicated with black triangles. Scale bar: 20 μm.

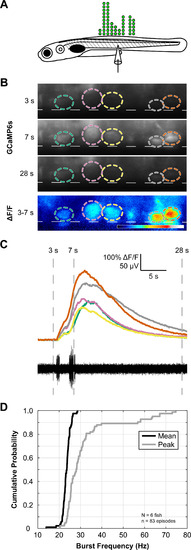
V3-IN activity is temporally correlated to fictive locomotion. A, Schematic representing the number and distribution of V3-INs (green circles) along the rostrocaudal axis of the spinal cord monitored during calcium imaging experiments. B, Each V3-IN in the field of view in Tg(vglut2a:Gal4ff)nns20;Tg(UAS:GCaMP6s)nk13a double transgenic larvae was assigned a ROI during spontaneous fictive swimming. Panels in B show raw GCaMP6s fluorescence (F) and correspond to numbered time points in C. Bottom panel in B shows calculated ΔF/F between 3- and 7-s time points. Dashed lines represent ventral boundary of the spinal cord. C, Synchronized recordings of GCaMP6s fluorescence (top) and fictive swimming (bottom) allowed identification of swimming-related neuronal activity. D, Plots of cumulative probability distributions for Mean (black line) and Peak (gray line) burst frequencies.

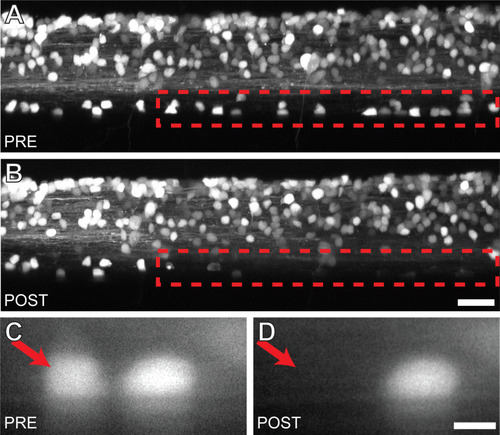
Targeted ablation of V3-INs is both efficient and spatially restricted. A, B, Confocal stacks of the same Tg(vglut2a:DsRed)nns9 zebrafish larva before (A) and 12 h after (B) laser ablation of the V3-INs in the region indicated (red dashed lines). C, D, A magnified view of two V3-INs before (left) and after (right) a single cell laser ablation. Scale bars: 20 μm (A, B) and 5 μm (C, D).

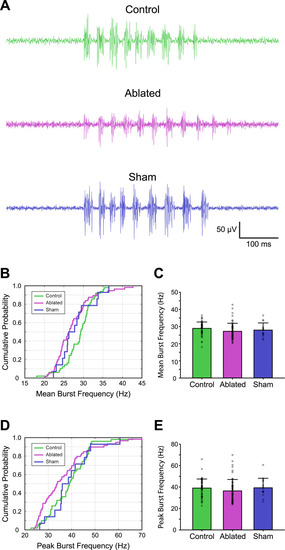
Targeted ablation of V3-INs does not affect burst frequency during spontaneous fictive locomotion. A, Representative traces of extracellular peripheral motor nerve recordings from Control (top), Ablated (middle), and Sham (bottom) groups. Summary plots of cumulative probability distribution (B) and mean burst frequencies (C). Summary plots of cumulative probability distribution (D) and peak burst frequencies (E).

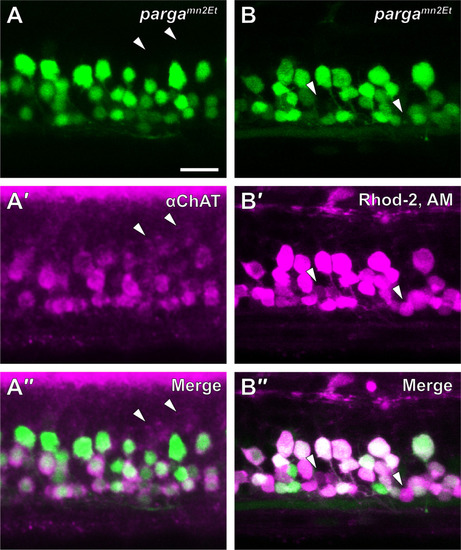
Spinal neurons loaded with rhodamine-2 AM dye are definitively identified as MNs. A, The EGFP-expressing pargamn2Et enhancer trap line (A, green) was labeled with antibodies to choline acetyl transferase (ChAT; A′, magenta). Colabeling (A′′) of EGFP with ChAT antibodies indicated that EGFP expression in the pargamn2Et line is a marker of spinal MNs. White arrowheads indicate ChAT-positive cells that do not contain EGFP (non-MNs). B, Live pargamn2Et larvae were anesthetized, skinned, and incubated in rhodamine-2 AM dye (Rhod-2, AM). EGFP expression (B, green) and Rhod-2, AM labeling (B′, magenta), showed that Rhod-2, AM specifically labeled all MNs (B′′). White arrowheads indicate two Rhod-2, AM-labeled cells that did not contain EGFP. Scale bar: 20 μm.

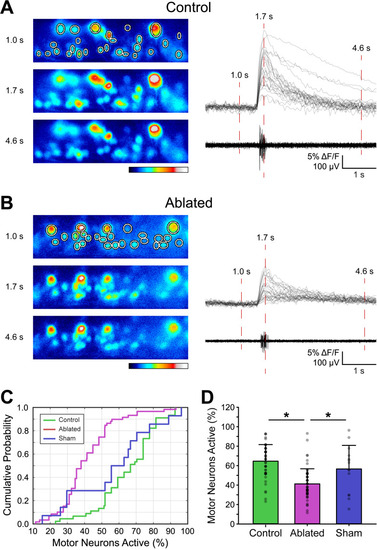
V3-IN laser ablation reduces the proportion of MNs that are active during fictive swimming. MNs in Tg(vglut2a:DsRed)nns9 larvae were loaded with Calcium Green-1 AM dye and assigned ROIs during recording. Synchronous MN fluorescence and fictive swimming recordings were compared between Control, V3-IN Ablated, and Sham ablated preparations. A, B, Pseudocolored Calcium Green-1 AM fluorescence panels correspond to numbered time points in aligned ΔF/F (each gray line represents a MN) and PN traces in a Control preparation (A) and a V3-IN Ablated preparation (B). Color indicates fluorescence intensity. C, D, Cumulative probability distributions (C) and percent of MNs active (D) during fictive swimming. Asterisks indicate significant differences at p < than 0.01. Error bars represent SD.

Acknowledgments
This image is the copyrighted work of the attributed author or publisher, and ZFIN has permission only to display this image to its users. Additional permissions should be obtained from the applicable author or publisher of the image. Full text @ eNeuro