Martins Fernandes Pereira, K., Calheiros de Carvalho, A., André Moura Veiga, T., Melgoza, A., Bonne Hernández, R., Dos Santos Grecco, S., Uchiyama Nakamura, M., Guo, S.
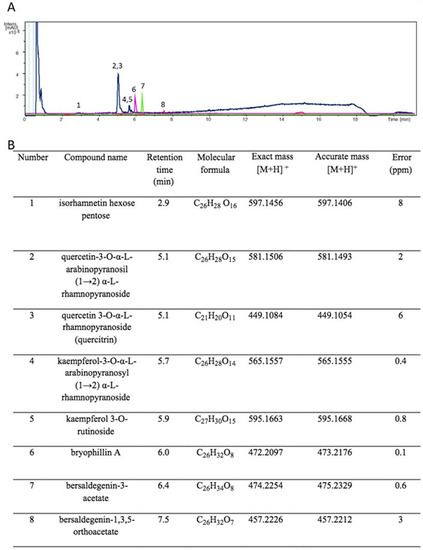
A. Overlapping of UV (ultraviolet) and EIC (extracted ions) chromatograms obtained from analysis of LABP analyzed by UPLC/DAD-ESI/HRMS/MS (electrospray ionization—positive ion mode). The blue line corresponds to the UV chromatogram. The purple, green and red lines correspond to the EIC. B. The table shows the compounds annotated following the peaks, retention times, molecular formulas, and masses.
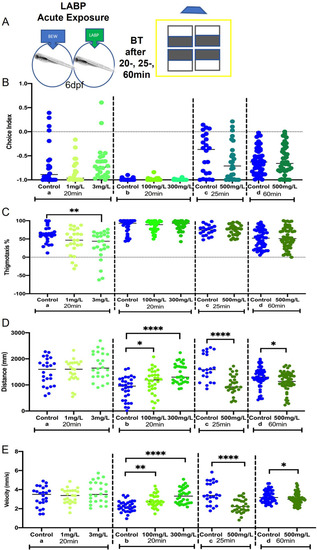
A. The schematic of the behavioral testing after LABP exposure (20, 25, or 60 min) in different concentrations (1, 3, 100, 300, or 500 mg/L). B. There was no significant difference in choice index between the control group and LABP treated groups. C. After 20 min of 3 mg/L LBP exposure decreased thigmotaxis significantly (p = 0.0082). The other groups did not show significant differences when compared to control. D. 100 and 300 mg/L LABP added 20 min before testing increased distance significantly (p = 0.0297 and p<0.0001, respectively). 500 mg/L LABP decreased the distance significantly after 25- and 60-min exposure both (p<0.0001 and p = 0.0285, respectively). E. 100 and 300 mg/L LABP added 20 min before testing increased velocity significantly (p = 0.0031 and p<0.0001, respectively). 500 mg/L LABP decreased velocity significantly after both 25- and 60-min exposure (p<0.0001 and p = 0.0254, respectively). Asterisks indicate statistical differences between groups (*p < 0.05, **p < 0.01, ***p < 0.001, ****p < 0.0001). n = 24/group a-20 min; 28/group b-20 min; 28/group c-25 min; 50/group d-60 min.
Behavior effects after LABP exposure during the sleep cycle.
A. The schematic of the behavior test after LABP exposure during the sleep cycle. The larvae were kept on dark and LABP exposure from 10 pm-8 am. B. 300 mg/L LABP significantly increased the choice index when compared to control (p = 0.0410). C. Thigmotaxis significantly showed a reduction in the group treated with 300 mg/L LABP when compared to the control group (p = 0.0346). D. Distance was increased in 300 mg/L LABP but not significantly (p = 0.0870). E. LABP significantly increased velocity in both 100 and 300 mg/L concentrations (p = 0.0416; p<0.0001). Asterisks indicate statistical differences between groups (*p < 0.05, **p < 0.01, ***p < 0.001, ****p < 0.0001). n = 30/group.
Behavior effects after sleep deprivation and LABP exposure.
A. The schematic of the behavior test after sleep deprivation + LABP exposure. The larvae were kept on light and LABP exposure during the sleep cycle. B. 100 mg/L LABP significantly increased the choice index when compared to control on light (p = 0.0438), while the normal control showed a significantly higher choice index when compared to control on light (p = 0.0009). C. Thigmotaxis did not show a significant difference between the groups. D. Distance was significantly decreased in control on light groups when compared to normal control (p = 0.0001). E. LABP treatment showed significantly high swimming velocity when compared to control on light (p = 0.0228), similar to normal control (p = 0.0015). Asterisks indicate statistical differences between groups (*p < 0.05, **p < 0.01, ***p < 0.001). n = 30/group.
Behavior effects after heat stressor and LABP exposure.
A. The schematic of the behavior test after the addition of a heat stressor + LABP exposure. B. 30 and 300 mg/L of hot LABP significantly increased the choice index when compared to hot BEW (p = 0.0473 and p = 0.0348, respectively). C. 30 mg/L of hot LABP significantly decreased the thigmotaxis when compared to hot BEW (p = 0.0314). D. There was a significant difference in distance between BEW at room temperature and hot BEW (p = 0.0334). E. There was no significant difference in velocity between the groups. Asterisks indicate statistical differences between groups (*p < 0.05). n = 30/group.
Acknowledgments
This image is the copyrighted work of the attributed author or publisher, and
ZFIN has permission only to display this image to its users.
Additional permissions should be obtained from the applicable author or publisher of the image.
Full text @ PLoS One
Your Input Welcome
Thank you for submitting comments. Your input has been emailed to ZFIN curators who may contact you if
additional information is required.
Oops. Something went wrong. Please try again later.