
- Title
-
Genetic ablation of the Bsx homeodomain transcription factor in zebrafish: Impact on mature pineal gland morphology and circadian behavior
- Authors
- Carstensen, M.B., Medvetzky, A., Weinberger, A., Driever, W., Gothilf, Y., Rath, M.F.
- Source
- Full text @ J. Pineal Res.
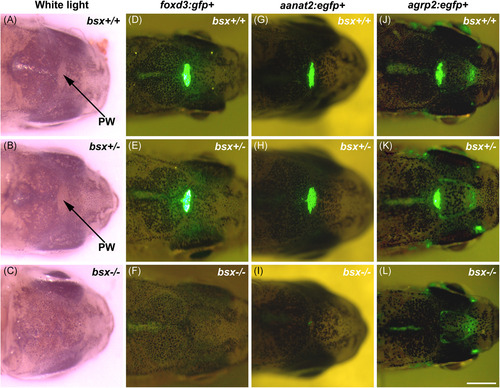
The pineal window and pineal marker signals are absent in adult bsx−/− mutant zebrafish. Representative light microscopy images of the pineal window (A–C) and in vivo fluorescence microscopy images of foxd3:gfp+ (D–F), aanat2:egfp+ (G–I), and agrp2:egfp+ (J–L) expression in adult wildtype (bsx+/+) (A, D, G, J), heterozygote (bsx+/−) (B, E, H, K) and homozygous bsx−/− mutant (C, F, I, L) zebrafish. Each column shows respective siblings from heterozygous incrosses; all fish were heterozygous for gfp or egfp. Scale bar, 1 mm. PW, pineal window |
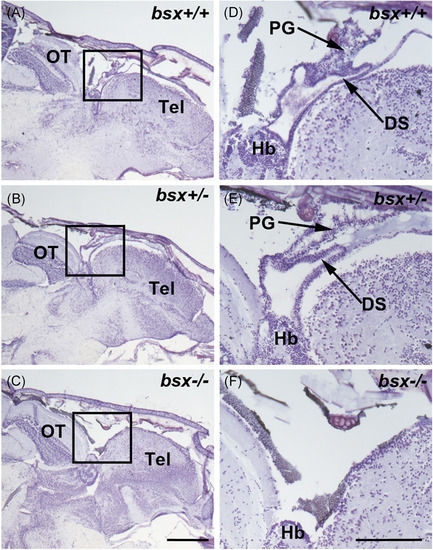
Pineal gland morphology is absent in adult bsx −/− mutant zebrafish. Representative images of sagittal sections of adult bsx−/− mutant zebrafish heads (C, F) stained in cresyl violet were examined at the midline. Images on the right (D–F) represent the boxed regions on the left (A–C) at higher magnification. Wildtype (bsx+/+) (A, D) and heterozygote (bsx+/−) (B, E) controls are shown for comparison. For examined brains, n = 4 per genotype. Scale bars, 500 µm (left) and 200 µm (right). DS, dorsal sac; Hb, habenula; OT, optic tectum; PG, pineal gland; Tel, telencephalon PHENOTYPE:
|
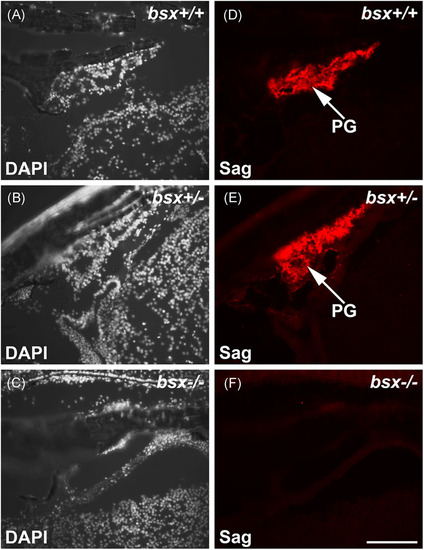
Pineal S-antigen protein is not detectable in adult bsx−/− mutant zebrafish. Immunofluorescent staining for S-antigen (Sag) on sagittal sections of adult bsx−/− mutant zebrafish heads (F) were examined at the midline; sections were also stained in DAPI (C). Wildtype (bsx+/+) (A, D) and heterozygote (bsx+/−) (B, E) controls are shown for comparison. For examined brains, n = 3 per genotype. Scale bar, 100 µm. PG, pineal gland |
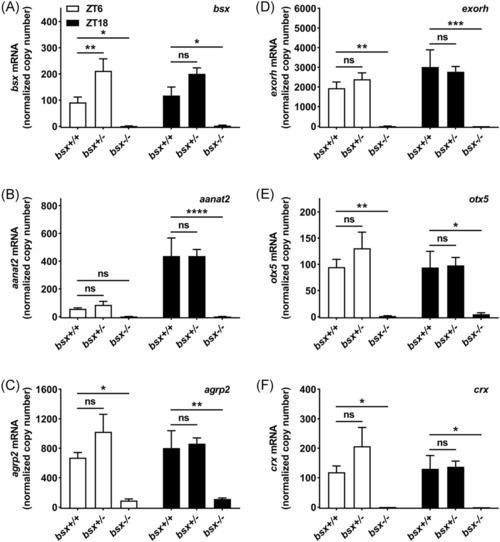
Transcript levels of pineal gland markers are greatly reduced in adult bsx−/− mutant zebrafish. Analyses of transcript levels of bsx (A) aanat2 (B), agrp2 (C), exorh (D), otx5 (E), and crx (F) at daytime (ZT6) and nighttime (ZT18) as determined by qRT-PCR. Copy numbers were normalized to the geometric means of copy numbers of eef1a1 and actb2, which were detected at high and stable levels in all samples; copy numbers were further divided by 100 to account for abundant transcript levels. Two-way ANOVA detected significant effects of time of day on transcript levels of aanat2 (p < .0001) and significant effects of genotype on transcript levels of bsx (p < .0001), aanat2 (p < .0001), agrp2 (p < .0001), exorh (p < .0001), otx5 (p < .001), and crx (p < .001). Transcript levels of homozygous (bsx−/−) and heterozygous (bsx+/−) mutants were compared to those of wildtype (bsx+/+) controls. Values on the graphs represent mean± SEM; n = 4, where each sample is pooled tissue from three animals. p-values as determined by multiplicity-adjusted Dunnett's multiple comparisons tests: ns, not significant, p > .05; *, p < .05; **, p < .01; ***, p < .001; ****, p < .0001. ZT, Zeitgeber time |
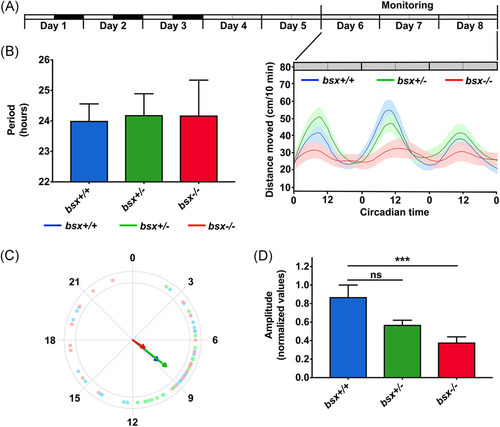
Behavioral rhythms of locomotor activity are disrupted in bsx mutant zebrafish larvae. (A) Locomotor activity of WT (blue, n = 20), bsx+/− (green, n = 38) and bsx−/− (red, n = 20) zebrafish larvae monitored under a constant dim light schedule (DimDim) from 6 to 8 dpf, after entrainment by three 1 L:12D cycles and two light-dim light cycles. The average distance moved (cm/10 min) is plotted on the y-axis and circadian time (CT) is plotted on the x-axis; error bars indicate SEM. The experimental design of the photic treatment before and throughout activity monitoring is shown at the top. White boxes represent light, black boxes represent dark, and gray boxes represent dim light. (B) Bar graphs displaying average periods of the three genotypes. No significant differences were detected by ANOVA (p > .05). (C) Circular plots of the average circadian phase of the rhythms of the three genotypes. Arrow directions represent the average phase for each genotype and arrow length represents the variance (longer arrow stands for low variance and vice versa); dots represent the values of individual larvae (note the high variance in bsx−/− mutant larvae). (D) Bar graphs displaying the mean amplitudes of the relative rhythms for the three genotypes, showing significant effect of the genotype (p = .0013, ANOVA); mutant (bsx−/−) larvae display a decreased amplitude compared to wildtype (bsx+/+) larvae (p < .001, Tukey's multiple comparisons tests). ***p < .001; ns, not significant |