FIGURE SUMMARY
Title

Cell Type-Specific Transcriptome Profiling Reveals a Role for Thioredoxin During Tumor Initiation

Authors
Korte, B.G., Giese, M.A., Ramakrishnan, G., Ma, S., Bennin, D., Rindy, J., Dewey, C.N., Huttenlocher, A.
Source
Full text @ Front Immunol

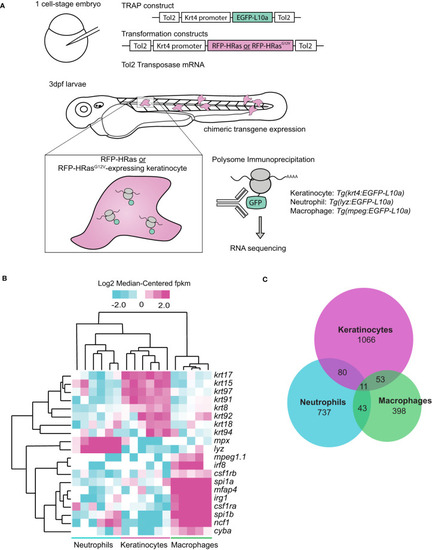
Oncogenic HRas induces differentially expressed genes in neutrophils and transformed cells in zebrafish larvae. (A) Schematic of Translating Ribosomal Affinity Purification (TRAP) procedure. Wild-type embryos were injected with the TRAP plasmid (pTol2-Krt4-EGFP-L10a) and either control (pTol2-Krt4-HRas-mcherry) or oncogenic transformation (pTol2-Krt4-HRasG12V-mcherry) constructs. Immunoprecipitation and sequencing were conducted 3dpf on batches of ~50 larvae collected on three separate days (n=3). Tg(LyzC : EGFP-L10a) or Tg(mpeg:EGFP-L10a) larvae were injected with either control (pTol2-Krt4-HRas-mcherry) or oncogenic Ras (pTol2-Krt4-HRasG12V-mcherry) constructs for neutrophil- or macrophage-targeted L10a expression, respectively. (B) Cell type specific genes expressed in keratinocytes (krt17, krt15, krt97, krt91, krt8, krt92, krt18, krt94), neutrophils (mpx,lyz), or macrophages (mpeg1.1, irf8, csf1rb, spi1a, mfap4, irg1, csf1ra, spi1b, ncf1, cyba) and their expression profiles in TRAP samples from keratinocytes, neutrophils, and macrophages. (C) Venn diagram showing distribution of genes altered >2fold by TRAP-seq in response to HRasG12V expressing keratinocytes (n=3).

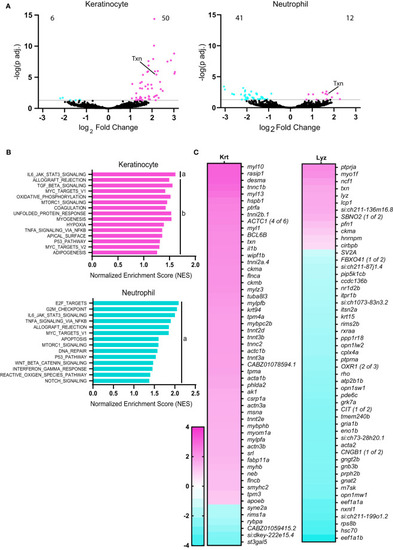
Thioredoxin expression is induced in neutrophils and keratinocytes with HRasG12V transformation. (A) Volcano plots displaying number of significantly (adjusted p<0.05) downregulated and upregulated genes in keratinocytes and neutrophils in HRasG12V-keratinocyte expressing zebrafish larvae, compared to wild-type HRas controls. (B) Gene Set Enrichment Analysis (GSEA) of significantly enriched Hallmark pathways in neutrophils and keratinocytes for HRasG12V-keratinocyte expressing zebrafish. FDR q-value is (a) below 0.10 or (b) 0.10-0.25. (C) Heat maps displaying significantly differentially expressed genes (adjusted p<0.05) in keratinocytes (56 genes) and neutrophils (53 genes).

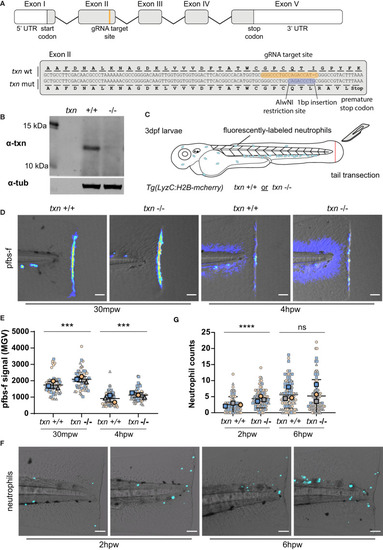
Thioredoxin regulates neutrophil recruitment and redox balance in damaged tissues. (A) Schematic of txn gene with annotations of gRNA target site and 1bp insertion identified in txn mutant larvae. (B) Western blot of Txn and αTubulin on whole lysates from txn wildtype and mutant larvae. (C) Schematic of tail transection assay to measure neutrophil recruitment and H2O2 abundance conducted on txn+/+ Tg(LyzC:H2B-mcherry) or txn-/-Tg(LyzC:H2B-mcherry) larvae 3dpf. (D) pfbs-f probe for H2O2 (1uM) in response to tail transection 30mpw (wt n=56, mut n=54) and 4hpw (wt n=51, mut n=51) with (E) quantification of signal density in region posterior to notochord. (F) Neutrophil recruitment in response to tail transection 2hpw (wt n=79, mut n=85) and 6hpw (wt n=87, mut n=90) with (G) quantification of neutrophil abundance in region posterior to notochord. Scale bar, 50um. Large, bolded shapes indicate average value per replicate (n), with small shapes representing data points from independent larvae. Samples were analyzed for statistical significance by Mann-Whitney U test (p < 0.001***, p < 0.0001****). ns, not significant.

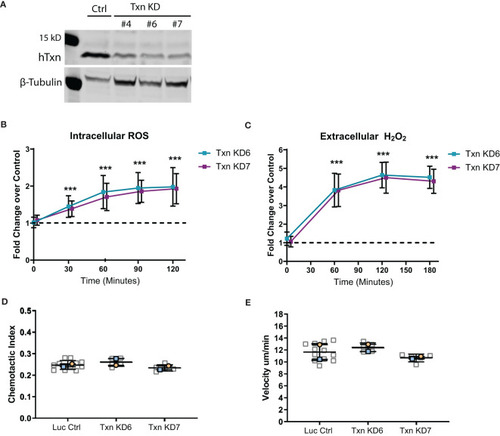
Thioredoxin depletion in a neutrophil-like cell line increases ROS but does not intrinsically affect motility. (A) Western blot of thioredoxin confirming CRISPR/Cas9 mediated txn knockdown in three HL60 clonal lines (KD4, KD6 and KD7) compared to luciferase control, with beta-tubulin as a loading control. (B) Quantification of intracellular ROS production (Carboxy-H2DCFDA probe) over time in txn knockdown lines compared to control (n=3). (C) Quantification of extracellular H2O2 production (Amplex Red/HRP Probe) over time in txn knockdown lines compared to control (n=3). (D) 2D chemotactic index and (E) mean track speed for txn knockdown lines compared to control (N = 2 repeats, n = 5-12 devices). Samples were analyzed for statistical significance via generalized estimating equation (GEE) fit to the log fold change with confidence intervals set to 95% coverage (B, C) or t-test (D, E) (p < 0.001***).

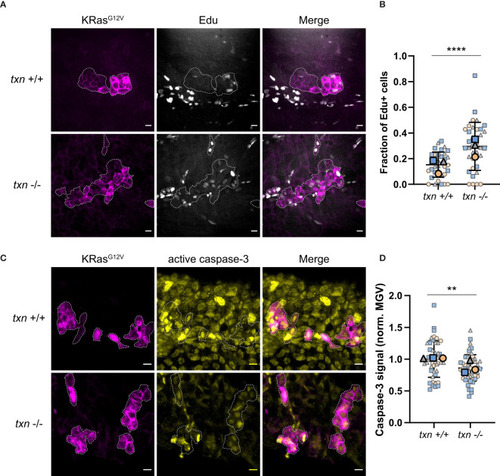
Transformed keratinocytes exhibit increased proliferation and reduced apoptosis during tumor initiation in thioredoxin mutants. (A) EdU staining (white) of txn+/+ or txn-/- larvae with KRasG12V-expressing basal keratinocytes (magenta) at 3dpf. (B) Quantification of the frequency of EdU-positive KRasG12V-expressing basal cells 3dpf in txn wt (n=35) and mutant (n=35) larvae. (C) Cleaved caspase-3 immunofluorescence of txn+/+ or txn-/- larvae. (D) Quantification of relative signal intensity within transformed cells 3dpf in txn+/+ (n=45) and txn-/- (n=51) larvae. Scale bar, 10um. Large, bolded shapes indicate average value per replicate (n), with small shapes representing data points from independent larvae. Samples were analyzed for statistical significance via t-test (p < 0.001***, p < 0.0001****).

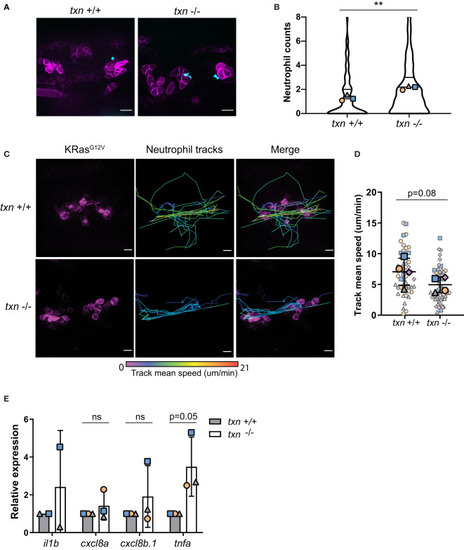
Thioredoxin affects neutrophil motility around KRasG12V-transformed keratinocytes. (A) Neutrophil (blue) recruitment around KRasG12V-expressing basal keratinocytes (magenta) in txn+/+ Tg(LyzC:H2B-mcherry) or txn-/- Tg(LyzC:H2B-mcherry) larvae 3dpf. (B) Quantification of neutrophil abundance in txn wt (n=74) and mutant (n=116) larvae. (C) Stills from live imaging of neutrophil behavior around KRasG12V-expressing cells in txn wt and mutant larvae. Neutrophils were tracked across frames (1.5min/frame) and track color delineates instantaneous neutrophil velocity. (D) Quantification of average neutrophil speed in txn wt (n=4) and mutant (n=4) larvae. (E) TRAP-qPCR of KRasG12V-expressing genes assessing inflammatory cytokines il1b, cxcl8a, cxcl8b.1, tnfa (pool, 30 larvae/replicate, wt n=3, mut n=3). Scale bar, 10uM. Bolded shapes indicate average values per larvae, and small shapes represent instantaneous velocities of individual neutrophils. Samples were analyzed for statistical significance via Mann-Whitney U test (B) and t-test (D, E) (p < 0.01**). ns, not significant.

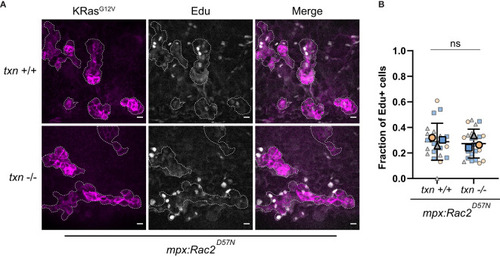
Transformed keratinocyte proliferation is not altered in thioredoxin mutants in the absence of neutrophils. (A) EdU staining (white) of neutrophil-deficient Tg(mpx:Rac2D57N-mcherry) txn+/+ and Tg(mpx:Rac2D57N-mcherry) txn-/- larvae with KRasG12V-expressing basal keratinocytes (magenta) 3dpf. (B) Quantification of frequency of EdU-positive KRasG12V-expressing basal keratinocytes 3dpf in Rac2D57N txn wt (n=21) and Rac2D57N txn mutant (n=22) larvae. Scale bar, 10um. Bolded shapes indicate average value per technical replicate, with shaded values representing data points from independent larvae. Samples were analyzed for statistical significance via t-test ns, not significant.

Acknowledgments
This image is the copyrighted work of the attributed author or publisher, and ZFIN has permission only to display this image to its users. Additional permissions should be obtained from the applicable author or publisher of the image. Full text @ Front Immunol