FIGURE

Figure 2

ID
ZDB-FIG-220309-26
Publication
Korte et al., 2022 - Cell Type-Specific Transcriptome Profiling Reveals a Role for Thioredoxin During Tumor Initiation
Other Figures
All Figure Page
Back to All Figure Page
Figure 2

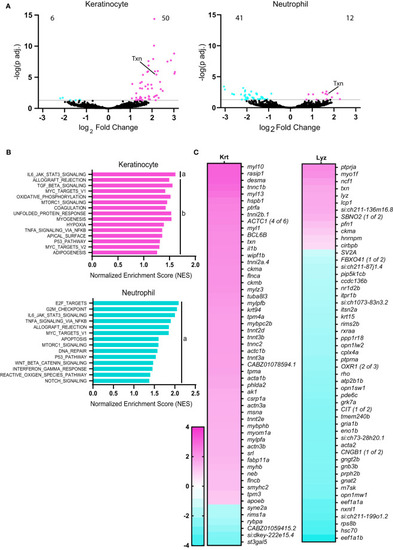
Thioredoxin expression is induced in neutrophils and keratinocytes with HRasG12V transformation. (A) Volcano plots displaying number of significantly (adjusted p<0.05) downregulated and upregulated genes in keratinocytes and neutrophils in HRasG12V-keratinocyte expressing zebrafish larvae, compared to wild-type HRas controls. (B) Gene Set Enrichment Analysis (GSEA) of significantly enriched Hallmark pathways in neutrophils and keratinocytes for HRasG12V-keratinocyte expressing zebrafish. FDR q-value is (a) below 0.10 or (b) 0.10-0.25. (C) Heat maps displaying significantly differentially expressed genes (adjusted p<0.05) in keratinocytes (56 genes) and neutrophils (53 genes).

Expression Data

Expression Detail
Antibody Labeling
Phenotype Data

Phenotype Detail
Acknowledgments
This image is the copyrighted work of the attributed author or publisher, and ZFIN has permission only to display this image to its users. Additional permissions should be obtained from the applicable author or publisher of the image. Full text @ Front Immunol