FIGURE SUMMARY
Title

Histone 3 Methyltransferases Alter Melanoma Initiation and Progression Through Discrete Mechanisms

Authors
DiNapoli, S.E., Martinez-McFaline, R., Shen, H., Doane, A.S., Perez, A.R., Verma, A., Simon, A., Nelson, I., Balgobin, C.A., Bourque, C.T., Yao, J., Raman, R., Béguelin, W., Zippin, J.H., Elemento, O., Melnick, A.M., Houvras, Y.
Source
Full text @ Front Cell Dev Biol

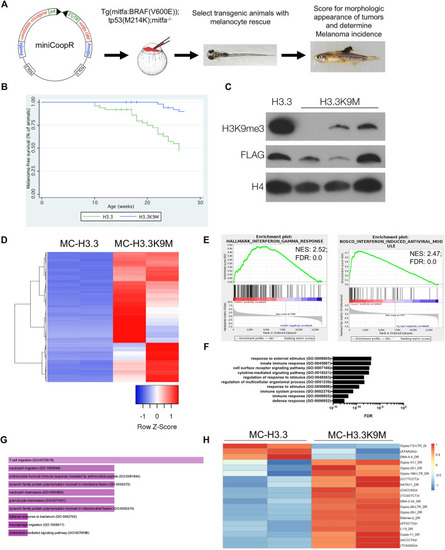
H3.3K9M suppresses melanoma formation. (A) The miniCoopR vector strategy overexpressing candidate genes in a melanocyte-specific fashion. Schematic adapted from Ceol et al. (2011). (B) Kaplan-Meier survival curves of Tg(mitfa:BRAF(V600E)); tp53zdf1/zdf1; mitfaw2/w2 zebrafish injected with indicated miniCoopR constructs (p value = 1.81e−06 calculated from log-rank test between miniCoopR H3.3 and H3.3K9M; 12 miniCoopR H3.3 and four H3.3K9M animals were censored from the study). (C) Western blot of acid-extracted histones from established tumors demonstrates a global loss of H3K9me3. (D) Top 1000 differentially expressed genes between miniCoopR H3.3 and H3.3K9M (sorted by p-value adjusted). (E) GSEA plots with enriched signatures in H3.3K9M tumors displaying enrichment for interferon responses. (F) Panther gene ontology analysis of the top 250 upregulated gene transcripts by p-value. (G) FishEnrichr analysis of the top 250 upregulated gene transcripts by p-value reveals neutrophil pathways among top 10 GO biological processes (Chen et al., 2013; Kuleshov et al., 2016). H, 16 of 19 transposable elements upregulated in H3.3K9M tumors.

H3.3K9M induces interferon response. (A) Western blot of acid-extracted histones in A375 cells expressing H3.3 WT or H3.3K9M transgenes. (B) Percentage of mScarlet+ cells sorted from a heterogeneous H3.3-mScarlet and H3.3K9M-mScarlet cell population using non-transfected cell as mScarlet control. (C) MA plot of H3.3K9M vs H3.3 (Peaks that change at FDR <0.01 are colored red). (D) Top 1000 differentially expressed genes between H3.3-mScarlet and H3.3K9M-mScarlet (sorted by p-value adjusted). (E) Plot displaying Enriched signatures in H3.3K9M expressing A375 cells. Plot generated by GO Biological Process 2018 Enrichr (Mi et al., 2013). (F) ATAC-seq peaks that are differentially more accessible in H3.3K9M cells. (G) RNA seq normalized counts for CD33 in sorted cells (n = 4), (p < 0.0001).

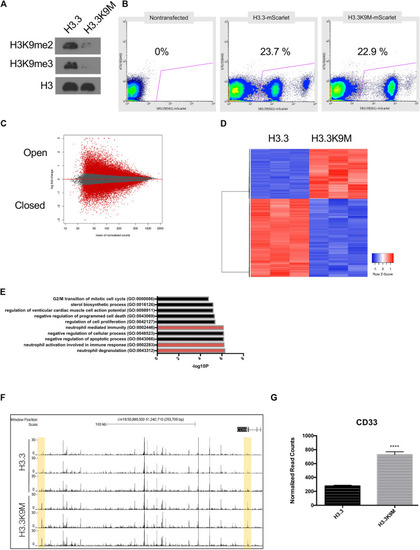
A-366 induces inflammatory response with no effect on cellular growth. (A) Western blot of acid-extracted histones from A375 cells incubated with either DMSO or 0.2 µM A-366 for 48 h. Densitometry analysis from four independent experiments. (B) A375 cells were treated with the indicated concentrations of A-366 for 10 days and assessed for colony formation. (C) Cell growth analysis of A375 cells treated with DMSO or A-366 (n = 3). (D) Top 100 differentially expressed genes between DMSO and A-366 treated cells (sorted by p-value adjusted). (E) GSEA plot showing enrichment in A-366 treated cells. (F) RNA seq normalized counts for CD33 in sorted cells (n = 4). (p < 0.0001).

PRC2 alterations in melanoma. (A,B) Oncoprint output of TCGA melanoma data from cBioPortal. Top, chromosomal alterations in PRC2 components are shown. Below, heatmap with mRNA levels of PRC2 components. (C) Lollipop plot of mutations in EZH2. Recurrent mutations with known effects on catalytic activity are denoted. (D) Percentage of cases from TCGA cohorts with the K27M mutation in any H3 gene. PAST, pilocytic astrocytoma; AML, acute myeloid leukemia; LGG/GBM, low-grade glioma/glioblastoma. Of the five MSK-IMPACT cases, n = 1 diffuse intrinsic pontine glioma; n = 1 glioma; n = 1 high-grade glioma; n = 1 glioblastoma; n = 1 primary melanoma. (E,F) Stratification of survival of human melanoma patients based on EED (E) and SUZ12 (F) mRNA levels in TCGA melanoma cases with expression data. Cases with low EED expression have mRNA expression less than 0.6 standard deviations below the mean. Cases with low SUZ12 expression have mRNA expression less than 0.5 standard deviations below the mean. Plots generated with cBioPortal. p-value calculated from the Log-Rank Test.

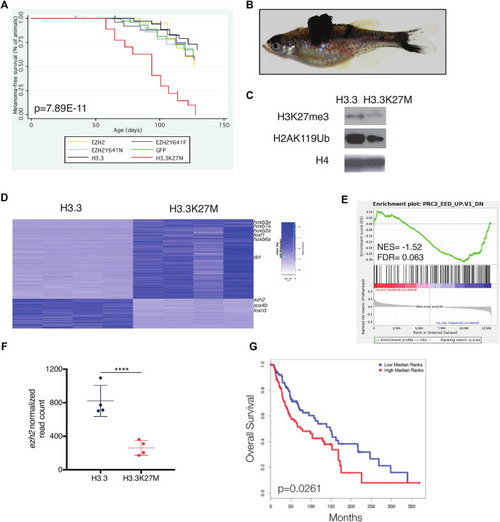
H3.3K27M accelerates melanoma formation. (A) Kaplan-Meier survival curves of Tg(mitfa:BRAF(V600E)); tp53zdf1/zdf1; mitfaw2/w2 zebrafish injected with indicated miniCoopR constructs. p value shown calculated from log-rank test between miniCoopR H3.3 and H3.3K27M. (B) Representative tumor-bearing miniCoopR H3.3K27M animal. (C) Western blot of indicated histone marks from miniCoopR H3.3 and H3.3K27M tumors. (D) Top differentially expressed genes between miniCoopR H3.3 and H3.3K27M. Genes with differential expression p < 1E05 are shown. (E) Gene set enrichment analysis (GSEA) of miniCoopR H3.3 and H3.3K27M tumors. NES, normalized enrichment score; FDR, false discovery rate; F, normalized read count of ezh2 from miniCoopR H3.3 and H3.3K27M tumors. p = 6.37E-06, log2 fold change = −1.52. (G) overall survival of human melanoma patients (N = 180) stratified into low (blue) or high (red) expression of 50 gene signature developed from miniCoopR H3.3K27M tumors.

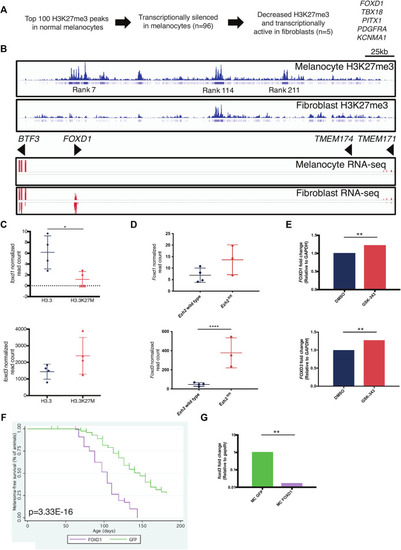
FOXD1 is a PRC2 target gene in melanocytes. (A) Scheme to identify melanocyte-specific PRC2 targets. (B) H3K27me3 (top) and RNA-seq (bottom) around the FOXD1 locus in melanocytes and fibroblasts. Rank indicates the rank of enrichment within the entire melanocyte genome ie, rank 7 is the seventh highest level of H3K27me3 enrichment in the melanocyte genome. (C) RNA-seq data of foxd1 (top) and foxd3 (bottom) levels within miniCoopR H3.3 and H3.3K27M zebrafish tumors. foxd1, p = 0.0397, L2FC = −1.33. foxd3, p = 0.101, L2FC = 0.656. (D) RNA-seq data of Foxd1 (top) and Foxd3 (bottom) levels in Ezh2 wild-type and Ezh2fl/fl mouse tumors. Foxd1, p = 0.185, L2FC = 0.853. Foxd3, p = 4.49E-11, L2FC = 2.81. (E) qPCR data of FOXD1 (top) and FOXD3 (bottom) levels in A375 human melanoma cells treated with EZH2 inhibitor GSK-343. FOXD1, p = 0.0098, L2FC = 1.218. FOXD3, p = 0.0037, L2FC = 1.275. (F) Kaplan-Meier survival curves of Tg(mitfa:BRAF(V600E)); tp53zdf1/zdf1; mitfaw2/w2 zebrafish injected with indicated miniCoopR constructs. p value shown calculated from log-rank test between miniCoopR GFP and FOXD1. (G) qPCR data of foxd3 levels in miniCoopR (MC) GFP and FOXD1 tumors, p = 0.0011.

Acknowledgments
This image is the copyrighted work of the attributed author or publisher, and ZFIN has permission only to display this image to its users. Additional permissions should be obtained from the applicable author or publisher of the image. Full text @ Front Cell Dev Biol