IMAGE

FIGURE 5

ID
ZDB-IMAGE-220303-35
Source
Figures for DiNapoli et al., 2022
Image
Figure Caption

FIGURE 5

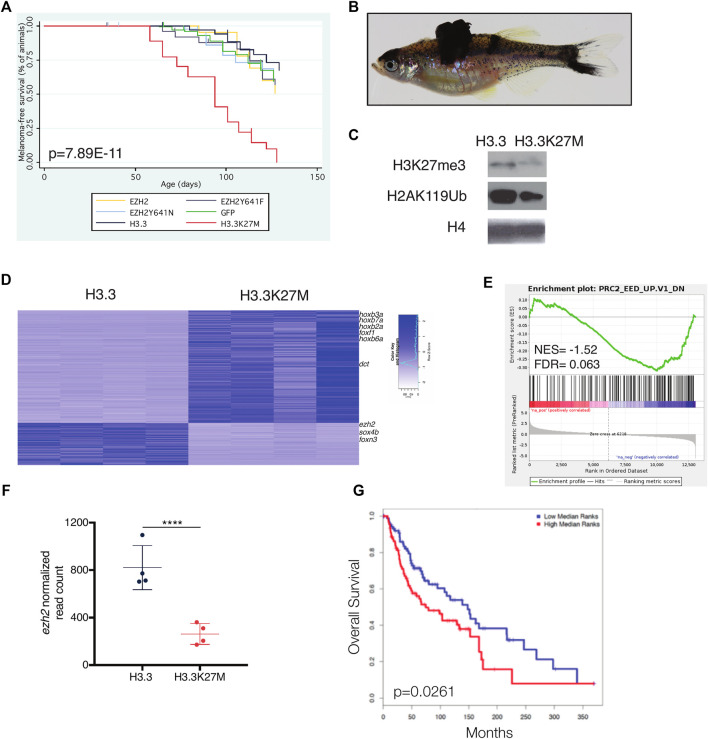
H3.3K27M accelerates melanoma formation. (A) Kaplan-Meier survival curves of Tg(mitfa:BRAF(V600E)); tp53zdf1/zdf1; mitfaw2/w2 zebrafish injected with indicated miniCoopR constructs. p value shown calculated from log-rank test between miniCoopR H3.3 and H3.3K27M. (B) Representative tumor-bearing miniCoopR H3.3K27M animal. (C) Western blot of indicated histone marks from miniCoopR H3.3 and H3.3K27M tumors. (D) Top differentially expressed genes between miniCoopR H3.3 and H3.3K27M. Genes with differential expression p < 1E05 are shown. (E) Gene set enrichment analysis (GSEA) of miniCoopR H3.3 and H3.3K27M tumors. NES, normalized enrichment score; FDR, false discovery rate; F, normalized read count of ezh2 from miniCoopR H3.3 and H3.3K27M tumors. p = 6.37E-06, log2 fold change = −1.52. (G) overall survival of human melanoma patients (N = 180) stratified into low (blue) or high (red) expression of 50 gene signature developed from miniCoopR H3.3K27M tumors.

Acknowledgments
This image is the copyrighted work of the attributed author or publisher, and ZFIN has permission only to display this image to its users. Additional permissions should be obtained from the applicable author or publisher of the image. Full text @ Front Cell Dev Biol