IMAGE

FIGURE 6

ID
ZDB-IMAGE-220303-37
Source
Figures for DiNapoli et al., 2022
Image
Figure Caption

FIGURE 6

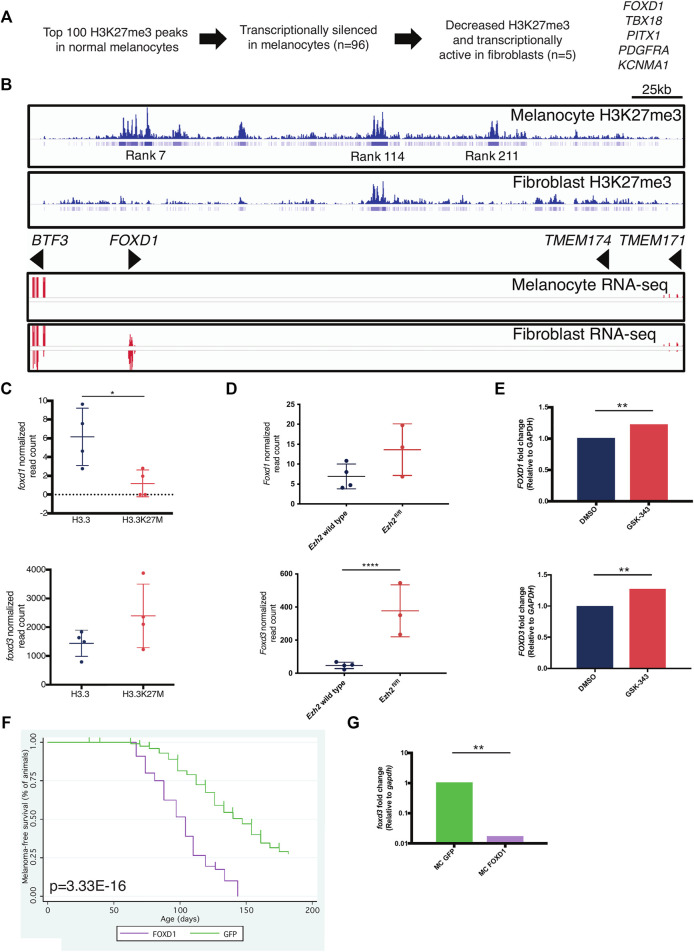
FOXD1 is a PRC2 target gene in melanocytes. (A) Scheme to identify melanocyte-specific PRC2 targets. (B) H3K27me3 (top) and RNA-seq (bottom) around the FOXD1 locus in melanocytes and fibroblasts. Rank indicates the rank of enrichment within the entire melanocyte genome ie, rank 7 is the seventh highest level of H3K27me3 enrichment in the melanocyte genome. (C) RNA-seq data of foxd1 (top) and foxd3 (bottom) levels within miniCoopR H3.3 and H3.3K27M zebrafish tumors. foxd1, p = 0.0397, L2FC = −1.33. foxd3, p = 0.101, L2FC = 0.656. (D) RNA-seq data of Foxd1 (top) and Foxd3 (bottom) levels in Ezh2 wild-type and Ezh2fl/fl mouse tumors. Foxd1, p = 0.185, L2FC = 0.853. Foxd3, p = 4.49E-11, L2FC = 2.81. (E) qPCR data of FOXD1 (top) and FOXD3 (bottom) levels in A375 human melanoma cells treated with EZH2 inhibitor GSK-343. FOXD1, p = 0.0098, L2FC = 1.218. FOXD3, p = 0.0037, L2FC = 1.275. (F) Kaplan-Meier survival curves of Tg(mitfa:BRAF(V600E)); tp53zdf1/zdf1; mitfaw2/w2 zebrafish injected with indicated miniCoopR constructs. p value shown calculated from log-rank test between miniCoopR GFP and FOXD1. (G) qPCR data of foxd3 levels in miniCoopR (MC) GFP and FOXD1 tumors, p = 0.0011.

Acknowledgments
This image is the copyrighted work of the attributed author or publisher, and ZFIN has permission only to display this image to its users. Additional permissions should be obtained from the applicable author or publisher of the image. Full text @ Front Cell Dev Biol