
- Title
-
A Zebrafish Model for a Rare Genetic Disease Reveals a Conserved Role for FBXL3 in the Circadian Clock System
- Authors
- Confino, S., Dor, T., Tovin, A., Wexler, Y., Ben-Moshe Livne, Z., Kolker, M., Pisanty, O., Park, S.K., Geyer, N., Reiter, J., Edvardson, S., Mor-Shaked, H., Elpeleg, O., Vallone, D., Appelbaum, L., Foulkes, N.S., Gothilf, Y.
- Source
- Full text @ Int. J. Mol. Sci.
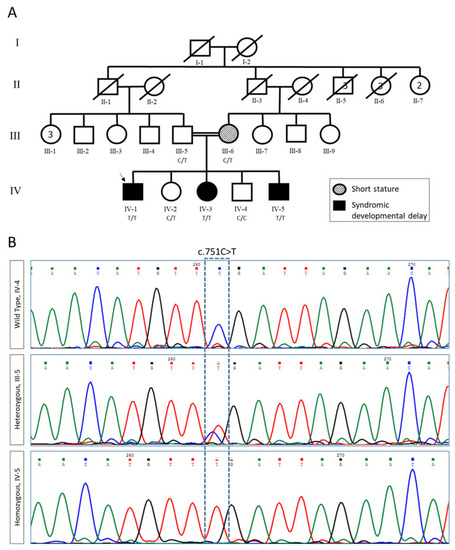
Pedigree and segregation analysis of FBXL3 variants. (A) Pedigree of the studied family. Proband is indicated by an arrow. (B) Sanger sequencing of wildtype (WT, IV-4), heterozygous carrier (III-5), and homozygous variant c.751C >T (IV-5). |
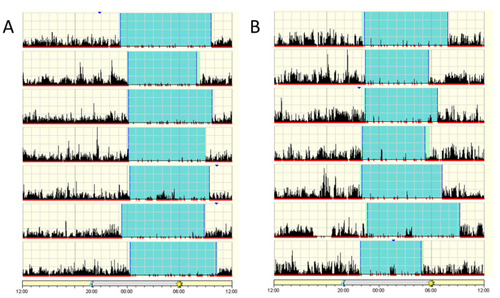
Patient actigraphs. Each horizontal segment in the actigraph represents a 24 h period from noon to noon the next day. The black lines indicate physical activity, with height of the lines corresponding to the occurrence and degree of physical activity. Periods of rest are highlighted in light green and sleep in cyan. (A) Patient IV-5, 10-year-old male. (B) Patient IV-3, 18-year-old female. Actigraphs show a regular sleep pattern with a set sleep time and mostly minor variations in wake-up time. |
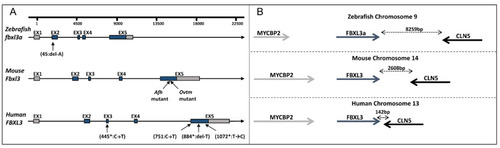
FBXL3 genomic region in humans, mice and zebrafish. (A) Schematic representation of FBXL3 gene arrangement. Untranslated and coding regions are depicted as grey and blue boxes, respectively; introns are depicted as lines. The position of reported mutations in zebrafish (this study), mouse (Afh and Ovtm [6,8]) and humans (*Ansar et al. [10], and this study) are indicated. (B) Illustration of FBXL3 conserved synteny with adjacent genes. Bidirectional arrows indicate the physical distance between nearby genes. |
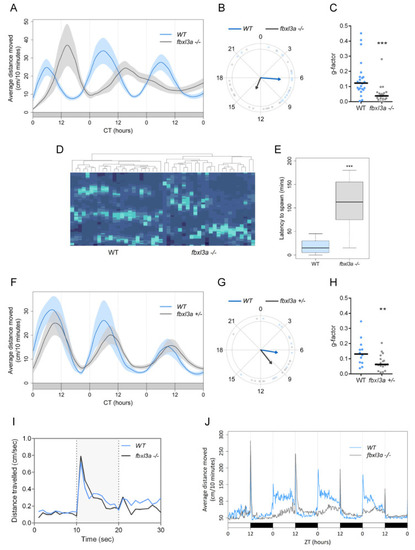
FBXL3a deficiency affects locomotor activity rhythms in zebrafish larvae under different lighting conditions. (A) Locomotor activity analysis of 6–8 days post-fertilization (dpf) WT and fbxl3a−/− larvae under constant dim light (DimDim) after entrainment to 3 light/dark (LD) cycles, followed by 2 light/dim light (LDim) cycles. The average distance travelled (cm/10 min) is plotted on the y-axis; circadian time (CT, hours) is plotted on the x-axis. Error bars represent ± SE (n = 24). (B) Phase difference expressed as activity peak with respect to CT0, indicating a 7.2 h phase-delay for the fbxl3a mutants (p < 0.001, Watson–Williams test). Arrows represent the mean value of each genotype; dots represent individual values; and arrow length is inversely related to the variation within genotype. (C) G-factor distribution of WT and fbxl3a−/− larvae under DimDim. Each dot represents the G-factor score of an individual larva; the median value for each genotype is indicated by a black horizontal line. A significant difference in G-factor distribution was determined between the two genotypes (*** p < 0.001, Wilcoxon test). (D) Clustering analysis represented by a heat map emphasizes the disordered rhythms of locomotor activity of fbxl3a−/− larvae. Right cluster, fbxl3a−/− larvae (n = 24); left cluster, WT siblings (n = 24). Significant clustering was determined between the two genotypes using Wilcoxon test (p < 0.001). (E) Delayed spawning time of adult fbxl3a−/− fish under LD conditions compared with their WT siblings (*** p < 0.001, Wilcoxon test, n = 16). (F) Locomotor activity analysis of 6–8 dpf WT (n = 12) and heterozygous (fbxl3a+/−, n = 18) larvae under DimDim after entrainment to three LD cycles, followed by 2 LDim cycles. The average distance travelled (cm/10 min) is plotted on the y-axis; CT (hours) is plotted on the x-axis. Error bars represent ± SE. (G) Phase difference expressed as activity peak with respect to CT0, indicating a 2.83 h difference between genotypes. Arrows represent the mean value of each genotype; dots represent individual values; and arrow length inversely represents variation within genotype. (H) G-factor distribution of WT and fbxl3a+/− larvae under DimDim. Each dot represents the G-factor score of an individual larva; the median value for each genotype is depicted as a black horizontal line. A significant difference in G-factor distribution was determined between the two genotypes (** p < 0.01, Wilcoxon test). (I) Larval mobility is not affected by fbxl3a LOF. On the 6th dpf, larvae (n = 24) were placed in the DanioVision tracking system. After acclimation to 2 h of light, three 10 s dark flashes, separated by 30 min of light, were applied. The activity of the larvae before, during (grey-shaded) and after the dark flashes was analyzed. No difference was observed between two genotypes, indicating that LOF of fbxl3a does not affect larval mobility. (J) Blunted locomotor activity rhythms of fbxl3a−/− larvae under LD cycles and their lack of response to dark-to-light transitions. The average distance travelled (cm/10 min) is plotted on the y-axis; zeitgeber time (ZT, hours) is plotted on the x-axis. Error bars represent ± SE (n = 24). White and black bars indicate light and dark conditions, respectively. |
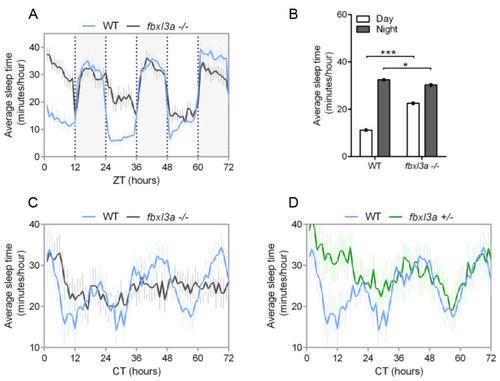
FBXL3a deficiency affects sleep–wake cycles in zebrafish larvae. Sleep analysis of 6–8 dpf fbxl3a−/−, fbxl3a+/− and WT sibling larvae under various lighting conditions. (A) Rhythms of sleep under LD are impaired in fbxl3a−/− larvae. The average sleep time under LD (minutes/hour) is plotted on the y-axis and ZT (hours) is plotted on the x-axis. Error bars represent ± SE (n = 24). White and grey-shaded areas indicate light and dark, respectively. (B) The average sleep time (±SE, n = 24) for total daytime and total nighttime for each genotype under LD conditions. Significant differences in day/night sleep time alterations were found between fbxl3a−/− larvae and their WT siblings (*** p < 0.001 and * p < 0.05 for day and night, respectively, repeated-measures ANOVA). (C) Circadian rhythms of sleep under DimDim, after entrainment by 3 LD and 2 LDim cycles, are impaired in fbxl3a−/− larvae (n = 18) compared to WT siblings (n = 12). The average sleep time (minutes/hour) under DimDim is plotted on the y-axis and CT (hours) is plotted on the x-axis. Error bars indicate ± SE. (D) Circadian rhythms of sleep under DimDim are impaired in fbxl3a+/− larvae (n = 18) compared to WT siblings (n = 12), the WT trace is the same as in C. Sleep measurement was conducted after entrainment by 3 LD and 2 LDim cycles. The average sleep time (minutes/hour) under DimDim is plotted on the y-axis and CT (hours) is plotted on the x-axis. Error bars represent ± SE. PHENOTYPE:
|
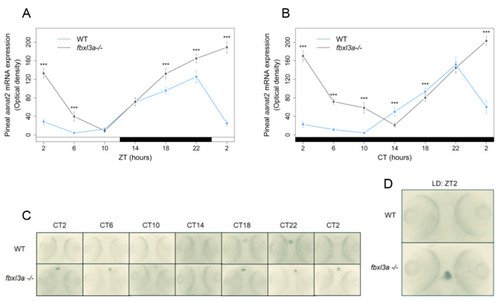
Clock-controlled aanat2 expression in the zebrafish pineal gland is affected by FBXL3a. Fbxl3a mutant larvae exhibit abnormal pineal aanat2 mRNA expression under constant dark (DD) and LD photoperiodic regimes (*** p < 0.001, t-test). Each value represents the mean optical density of pineal aanat2 expression using whole mount in situ hybridization (ISH) quantification (n = 15–20). ZT (hours) is indicated for each sample; white and black bars represent light and dark, respectively. Pineal aanat2 ISH quantification of 72–96 h post-fertilization (hpf) fbxl3a−/− larvae and their WT siblings under LD (A) or DD (B) conditions, after entrainment by three LD cycles. (C) Representative pineal aanat2 ISH signal of 72–96 hpf fbxl3a−/− larvae (bottom panel) and their WT siblings (top panel) under DD conditions. (D) Pineal aanat2 signal of a 96 hpf fbxl3a−/− larva and its WT sibling after four LD cycles (at ZT2). EXPRESSION / LABELING:
PHENOTYPE:
|
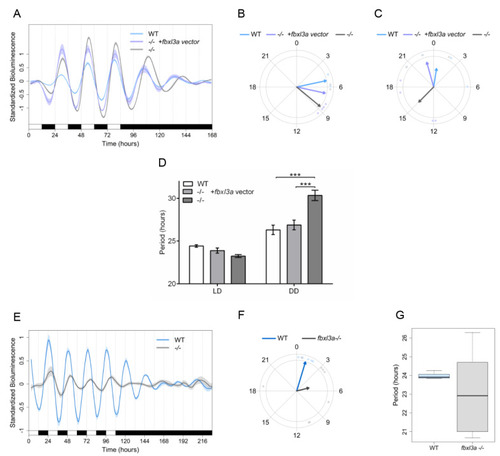
FBXL3a LOF disrupts core molecular oscillation in zebrafish cells. (A) Impaired per1b promoter activity in fbxl3a−/− cell line is partially rescued by exogenous FBXL3a. Standardized luciferase activity in per1b:luc-transfected cell lines derived from fbxl3a−/− and their WT siblings under different lighting conditions. Cells were transfected with the per1b:luc construct and with a FBXL3a expression vector or empty vector. Error bars represent ±SE (n = 4). (B) Phase difference under LD conditions is expressed as activity peak with respect to ZT0, indicating a 3.45 h phase-delay for the fbxl3a−/− cell line, which is partially rescued by exogenously expressed FBXL3a, yielding a 1.61 h phase-delay. Arrows represent the mean value of the studied cell line, dots represent individual well values, and arrow length inversely represents the variation among wells of the same cell line. (C) Phase difference under DD conditions is expressed as activity peak with respect to CT0, indicating a 14.38 h phase-delay of the fbxl3a−/− cell line, which is partially rescued by exogenous FBXL3a, inducing a 1.63 h phase advance. Arrows represent the mean value of the studied cell line, dots represent individual well values, and arrow length inversely represents the variation among wells of the same cell line. (D) Mean period values of bioluminescence rhythms of cells transfected with per1b:luc construct and with the FBXL3a expression vector or empty vector. Period (hours) under LD: WT = 24.42, fbxl3a−/− = 23.24, fbxl3a−/− + FBXL3a expression vector = 23.88; Period (hours) under DD: WT = 26.31, fbxl3a−/− = 30.34, and fbxl3a−/− + FBXL3a expression vector = 26.88. Error bars represent ± SE (n = 8). Statistical differences were assessed by ANOVA, followed by pairwise comparisons adjusted by the BH procedure controlling FDR at level 0.05 (*** p < 0.001). (E) Standardized bioluminescence in E-box:luc-transfected cell lines derived from fbxl3a−/− and their WT siblings under five LD cycles followed by 5 days of DD. Error bars represent ± SE (n = 8 wells). (F) A delayed phase of the synthetic E-box promoter activity in the fbxl3a−/− cell line under LD. Phase difference expressed as activity peak with respect to ZT0, indicating a 4.07 h difference between cell line genotypes. Arrows represent the mean value of the studied cell line, dots represent individual well values, and arrow length inversely represents the variation among wells of the same cell line. Significance was determined using Watson–Williams test (p < 0.001). (G) Abnormal period distribution of E-box:luc expression in fbxl3a−/− cell line. Mean period values and distribution of luciferase activity under five LD cycles (WT = 23.91 IQR = 0.38, fbxl3a mutant = 23.37 IQR = 7.29). |