
|
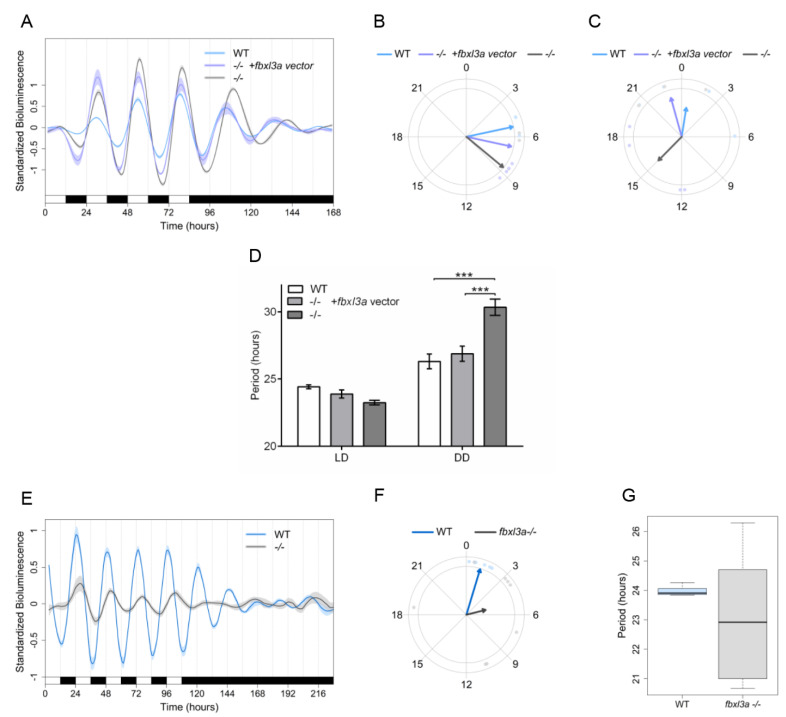
Figure 7
FBXL3a LOF disrupts core molecular oscillation in zebrafish cells. (A) Impaired per1b promoter activity in fbxl3a−/− cell line is partially rescued by exogenous FBXL3a. Standardized luciferase activity in per1b:luc-transfected cell lines derived from fbxl3a−/− and their WT siblings under different lighting conditions. Cells were transfected with the per1b:luc construct and with a FBXL3a expression vector or empty vector. Error bars represent ±SE (n = 4). (B) Phase difference under LD conditions is expressed as activity peak with respect to ZT0, indicating a 3.45 h phase-delay for the fbxl3a−/− cell line, which is partially rescued by exogenously expressed FBXL3a, yielding a 1.61 h phase-delay. Arrows represent the mean value of the studied cell line, dots represent individual well values, and arrow length inversely represents the variation among wells of the same cell line. (C) Phase difference under DD conditions is expressed as activity peak with respect to CT0, indicating a 14.38 h phase-delay of the fbxl3a−/− cell line, which is partially rescued by exogenous FBXL3a, inducing a 1.63 h phase advance. Arrows represent the mean value of the studied cell line, dots represent individual well values, and arrow length inversely represents the variation among wells of the same cell line. (D) Mean period values of bioluminescence rhythms of cells transfected with per1b:luc construct and with the FBXL3a expression vector or empty vector. Period (hours) under LD: WT = 24.42, fbxl3a−/− = 23.24, fbxl3a−/− + FBXL3a expression vector = 23.88; Period (hours) under DD: WT = 26.31, fbxl3a−/− = 30.34, and fbxl3a−/− + FBXL3a expression vector = 26.88. Error bars represent ± SE (n = 8). Statistical differences were assessed by ANOVA, followed by pairwise comparisons adjusted by the BH procedure controlling FDR at level 0.05 (*** p < 0.001). (E) Standardized bioluminescence in E-box:luc-transfected cell lines derived from fbxl3a−/− and their WT siblings under five LD cycles followed by 5 days of DD. Error bars represent ± SE (n = 8 wells). (F) A delayed phase of the synthetic E-box promoter activity in the fbxl3a−/− cell line under LD. Phase difference expressed as activity peak with respect to ZT0, indicating a 4.07 h difference between cell line genotypes. Arrows represent the mean value of the studied cell line, dots represent individual well values, and arrow length inversely represents the variation among wells of the same cell line. Significance was determined using Watson–Williams test (p < 0.001). (G) Abnormal period distribution of E-box:luc expression in fbxl3a−/− cell line. Mean period values and distribution of luciferase activity under five LD cycles (WT = 23.91 IQR = 0.38, fbxl3a mutant = 23.37 IQR = 7.29).