
- Title
-
The LCP Family Protein, Psr, Is Required for Cell Wall Integrity and Virulence in Streptococcus agalactiae
- Authors
- Rajaei, A., Rowe, H.M., Neely, M.N.
- Source
- Full text @ Microorganisms
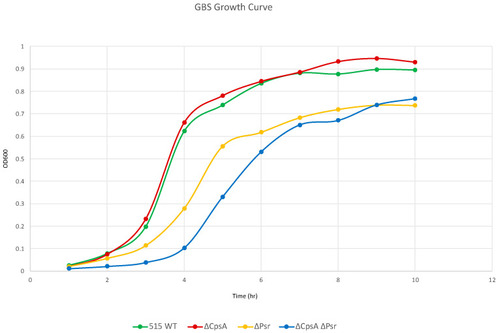
GBS growth decreases in the absence of Psr. Overnight cultures were subcultured 1:100 in fresh media and grown statically at 37 °C. OD600 was measured via spectrophotometer at the specified time points. Graph is representative of three separate growth curves. |
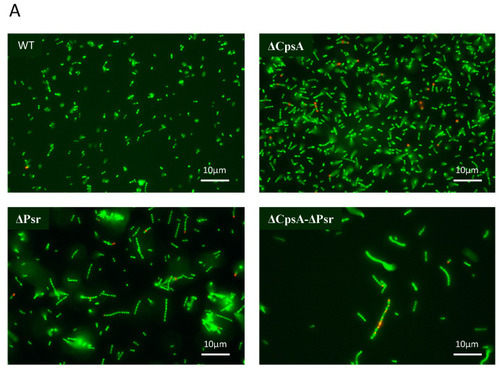
GBS cell viability is significantly affected at stationary phase. GBS strains were grown to mid-log and stationary phase in THY medium, normalized to OD600: 0.6 in 0.85% NaCl and treated with live/dead stain. (A) Images of cells grown to mid-log phase, where green cells represent live cells and red cells represent dead cells. (B) Images of cells grown to stationary phase, where green cells represent live cells and red cells represent dead cells. (C) Percentage of live cells were quantified. Micrographs of each strain were imaged and 10 fields of view per strain were used to quantify percentage of live cells. |
GBS cell viability is significantly affected at stationary phase. GBS strains were grown to mid-log and stationary phase in THY medium, normalized to OD600: 0.6 in 0.85% NaCl and treated with live/dead stain. (A) Images of cells grown to mid-log phase, where green cells represent live cells and red cells represent dead cells. (B) Images of cells grown to stationary phase, where green cells represent live cells and red cells represent dead cells. (C) Percentage of live cells were quantified. Micrographs of each strain were imaged and 10 fields of view per strain were used to quantify percentage of live cells. |
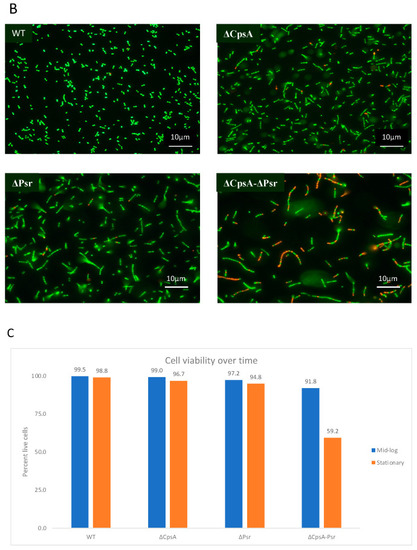
GBS chain length increases in the absence of CpsA and Psr. Overnight cultures were mounted on microscope slides and visualized via brightfield microscopy. (A) Micrograph images of each of the four GBS strains pipetted onto a glass slide. (B) A quantitative representation of the chain length analysis. Images using 10 fields of view from each strain were used to quantify the number of cocci in each chain, with green line indicative of median chain length. |
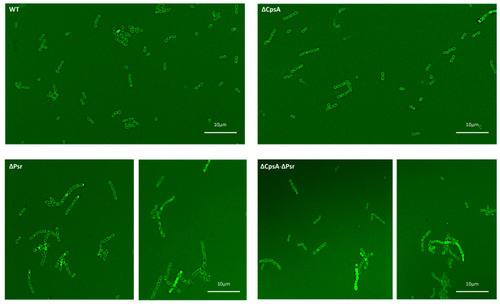
Bacterial cocci morphology changes in the absence of Psr. Overnight cultures were incubated with fluorescent vancomycin and imaged via confocal microscopy. WT and the ΔCpsA strains exhibit shorter chains, uniform cocci morphology and intact cell walls, whereas the ΔPsr and ΔCpsA-ΔPsr mutant strains exhibit longer chain lengths, leaky cell walls and anomalous cell morphologies. Micrographs are representative of images recorded from two assays repeated on 2 different days. |
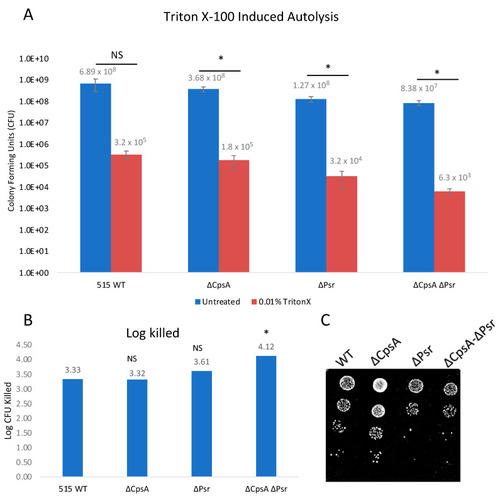
GBS autolysis increases in the presence of Triton X-100. GBS strains were grown to mid-log in THYB, normalized to OD600: 0.3 in PBS and treated with 0.01% Triton X-100 for 2 h. (A) Treated (Red) and untreated (Blue) samples were then serially diluted and plated on THY plates. Statistical analysis represents significance between untreated and treated cells for each strain. (B) Log CFU killed was calculated for each sample by taking log10 (untreated/treated). Significance was determined by comparing log CFU killed of each strain to that of wild type GBS. (C) 5 μL of serial dilutions of treated cells was dotted on THY plates and grown overnight for visual representation of treatment outcomes. Values represented are averages of six biological replicates. * p < 0.05. |
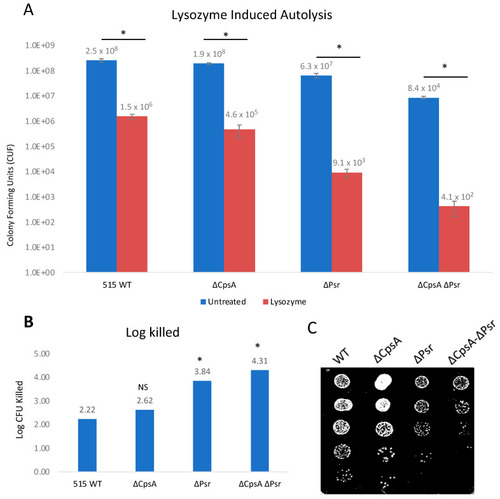
GBS autolysis increases in the presence of lysozyme. GBS strains were grown to mid-log in THYB, normalized to OD600: 0.3 in PBS and treated with 1 mg/mL lysozyme for 24 h. (A) Treated (Red) and untreated (Blue) samples were then serially diluted and plated on THY plates and counted. Statistical analysis represents significance between untreated and treated cells for each strain. (B) Log CFU killed was calculated for each sample taking Log10 (untreated/treated). Significance was determined by comparing log CFU killed of each strain to that of wild type GBS. (C) 5 μL of serial dilutions of treated cells was dotted on THY plates and grown overnight for visual representation of treatment outcomes. Values represented are averages of four biological replicates. * p < 0.05. |
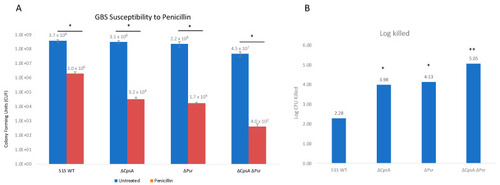
GBS susceptibility to penicillin increases in the absence of CpsA and Psr. GBS strains were grown in THY medium, normalized to OD600: 0.01 in PBS and treated with 3 μg/mL penicillin for 24 h. (A) Treated (Red) and untreated (Blue) samples were then serially diluted and plated on THY plates and counted. Statistical analysis represents significance between untreated and treated cells for each strain. (B) Log CFU killed was calculated for each sample taking Log10 (untreated/treated). Significance was determined by comparing log CFU killed of each strain to that of wild type GBS. Values represented are averages of four biological replicates. * p < 0.05, ** p < 0.005. |
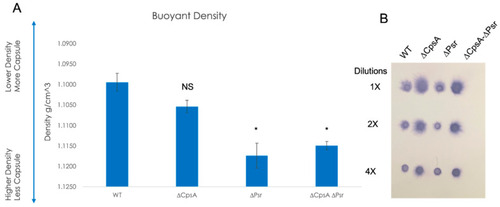
Capsule on the cell surface decreases in the absence of LCP proteins. (A) Percoll buoyant density centrifugation revealed less capsule in ΔCpsA, ΔPsr and ΔCpsA-ΔPsr strains in comparison to WT GBS. (B) Dot blot analysis on supernatants of WT, ΔCpsA, ΔPsr and ΔCpsA-ΔPsr strains reveals that more supernatant is released into the supernatant of ΔCpsA and ΔCpsA-ΔPsr strains. Significance was determined by comparing densities of each strain to that of wild type GBS. Values represented are averages of three biological replicates. * p < 0.05. |
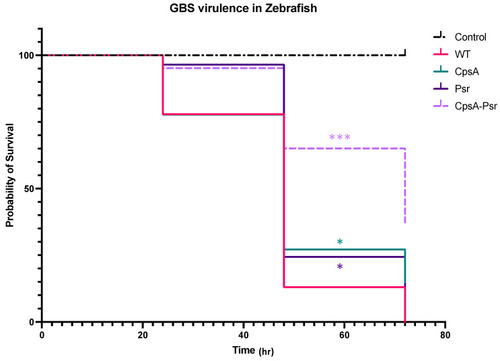
CpsA-Psr double mutant results in decreased virulence on GBS in vivo. GBS virulence was examined in vivo by injecting the yolk sacs of zebrafish 3 days post-fertilization with 100 CFU of WT, ΔCpsA, ΔPsr and ΔCpsA-ΔPsr mutant strains. Values represented are averages of four biological replicates, with a minimum of 105 total zebrafish injected per strain. * p < 0.05, *** p < 0.0005. |