
Figure 5
- ID
- ZDB-IMAGE-220302-152
- Publication
- Rajaei et al., 2022 - The LCP Family Protein, Psr, Is Required for Cell Wall Integrity and Virulence in Streptococcus agalactiae
- All Figures
- Figures for Rajaei et al., 2022
|
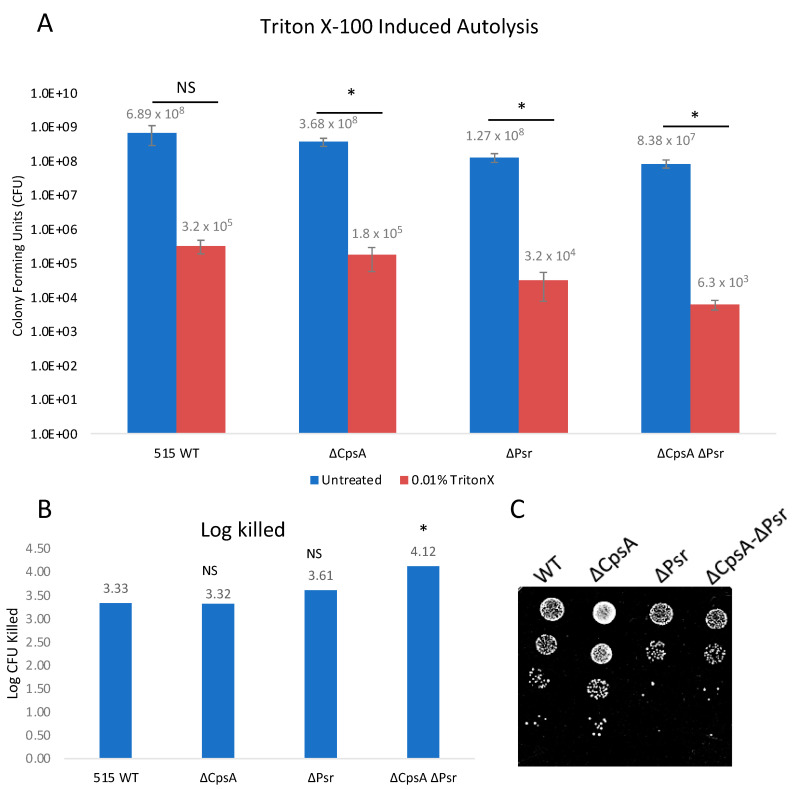
Figure 5
GBS autolysis increases in the presence of Triton X-100. GBS strains were grown to mid-log in THYB, normalized to OD600: 0.3 in PBS and treated with 0.01% Triton X-100 for 2 h. (A) Treated (Red) and untreated (Blue) samples were then serially diluted and plated on THY plates. Statistical analysis represents significance between untreated and treated cells for each strain. (B) Log CFU killed was calculated for each sample by taking log10 (untreated/treated). Significance was determined by comparing log CFU killed of each strain to that of wild type GBS. (C) 5 μL of serial dilutions of treated cells was dotted on THY plates and grown overnight for visual representation of treatment outcomes. Values represented are averages of six biological replicates. * p < 0.05.